

Question: Data Screening The researcher sorted the data and scanned for inconsistencies on each variable. No data errors or inconsistencies were identified. A matrix scatter
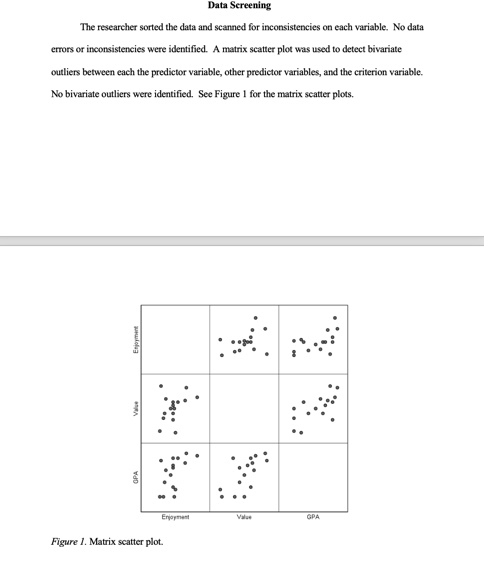
Data Screening The researcher sorted the data and scanned for inconsistencies on each variable. No data errors or inconsistencies were identified. A matrix scatter plot was used to detect bivariate outliers between each the predictor variable, other predictor variables, and the criterion variable. No bivariate outliers were identified. See Figure 1 for the matrix scatter plots. Enjoyment A Figure 1. Matrix scatter plot. Enjoyment Value GPA
Step by Step Solution
There are 3 Steps involved in it
1 Expert Approved Answer
Step: 1 Unlock

Question Has Been Solved by an Expert!
Get step-by-step solutions from verified subject matter experts
Step: 2 Unlock
Step: 3 Unlock