

Question: Data set 1: Response variable : babys birth weight : 4.55ibs Gestation : 44 mothers age : 20 mothers daily cigarette: 0 mothers height :
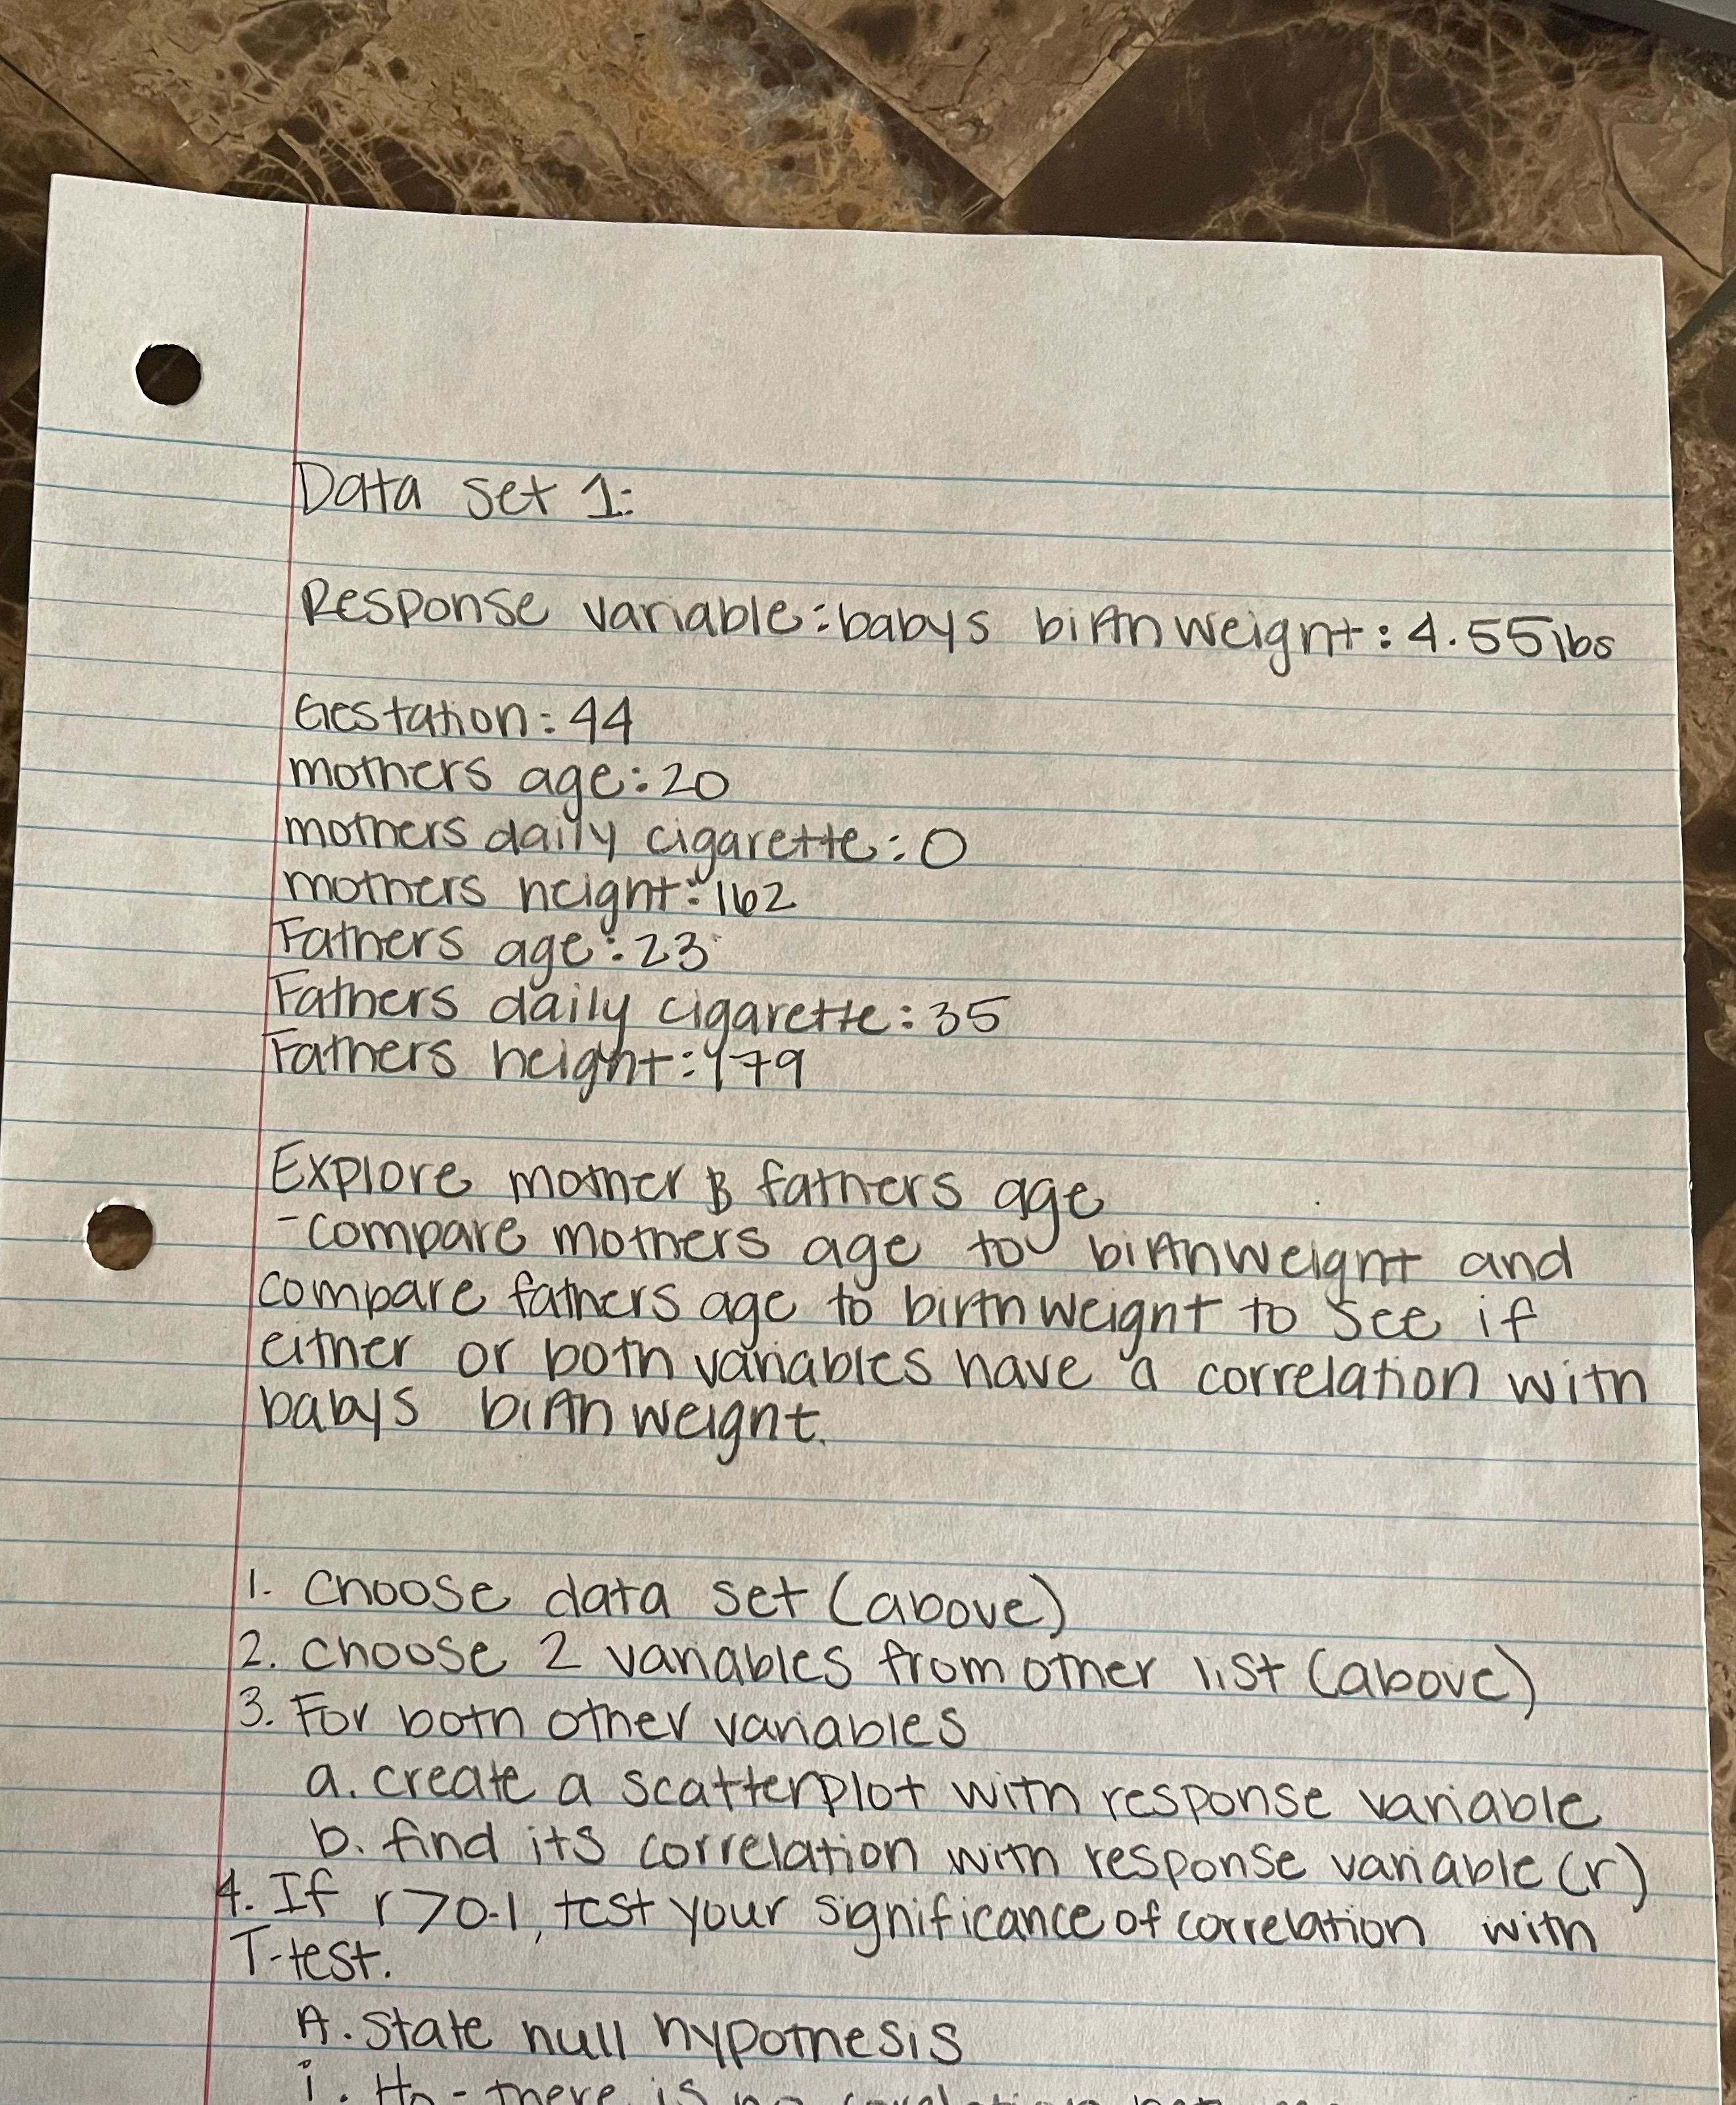
Data set 1: Response variable : babys birth weight : 4.55ibs Gestation : 44 mothers age : 20 mothers daily cigarette: 0 mothers height : 162 Fathers age : 23 Fathers daily cigarette : 35 Fathers height : 179 Explore mother B fathers age - compare mothers age to birthweight and compare fathers age to birth weight to see if either or both variables have a correlation with babys binh weight 1. Choose data set (above) 2. choose 2 vanables from other list (above ) 3 . For both other variables a. create a scatterplot with response variable b. find its correlation with response van able () 4. If r70-1 test your significance of correlation with T-test . A. state null hypothesis 1 . Ho - they
Step by Step Solution
There are 3 Steps involved in it

Get step-by-step solutions from verified subject matter experts