

Question: Data Source: Wealthiest Americans.xlsx A. Generate a boxplot in Excel for the variable, age. (10 points) a. Are there any outliers? If so, provide
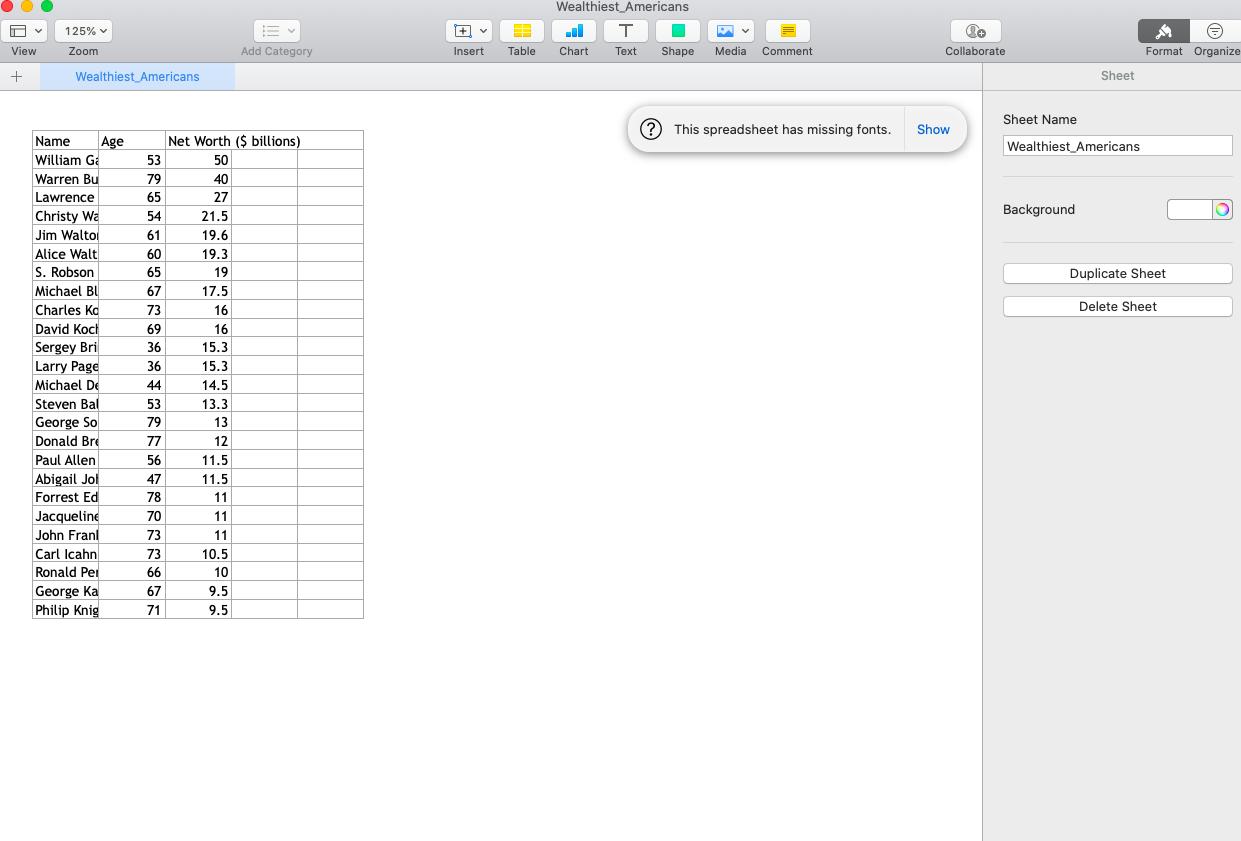
Data Source: Wealthiest Americans.xlsx A. Generate a boxplot in Excel for the variable, "age." (10 points) a. Are there any outliers? If so, provide empirical evidence. Hint: how do you use scientific evidence to show the presence or absence of outliers? B. Report the following descriptive statistics for "Net Worth" using Excel (provide units where appropriate) (20 points): i. Mean ii. Median iii. Min iv. Max V. Q1 vi. Q3 vii. Standard deviation viii. Variance Hint: What are the units for variance? How is different from standard deviation? View 125% + Wealthiest Americans T Zoom Add Category Insert Table Chart Text Shape Media Comment Wealthiest Americans Name Age Net Worth ($ billions). William Ga 53 50 Warren Bu 79 40 Lawrence 65 27 Christy Wa 54 21.5 Jim Walto 61 19.6 Alice Walt 60 19.3 S. Robson 65 19 Michael Bl 67 17.5 Charles Ko 73 16 David Koch 69 16 Sergey Bri 36 15.3 Larry Page 36 15.3 Michael De 44 14.5 Steven Bal 53 13.3 George So 79 13 Donald Bre 77 12 Paul Allen 56 11.5 Abigail Jol 47 11.5 Forrest Ed 78 11 Jacqueline 70 11 John Franl 73 11 Carl Icahn 73 10.5 Ronald Per 66 10 George Ka 67 9.5 Philip Knig 71 9.5 Collaborate Format Organize Sheet Sheet Name This spreadsheet has missing fonts. Show Wealthiest Americans Background Duplicate Sheet Delete Sheet
Step by Step Solution
There are 3 Steps involved in it

Get step-by-step solutions from verified subject matter experts