

Question: Data Table 2018 2017 2016 2015 Net sales............... $ 878,000 $ 822,000 $ 847,000 $ 831,000 Net income .............. 186,000 162,000 179,000 170,000 Ending total
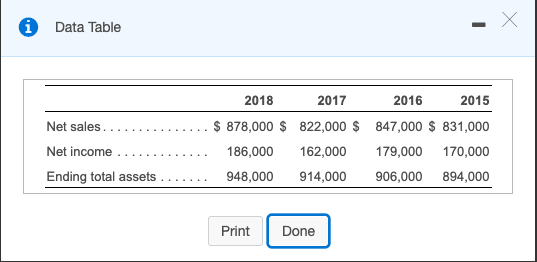
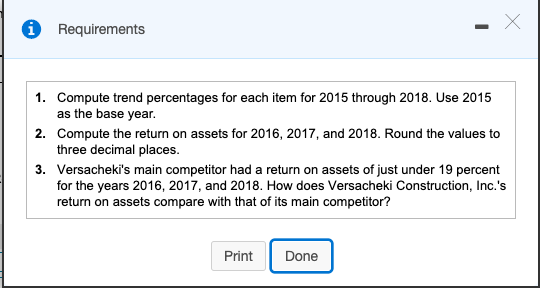
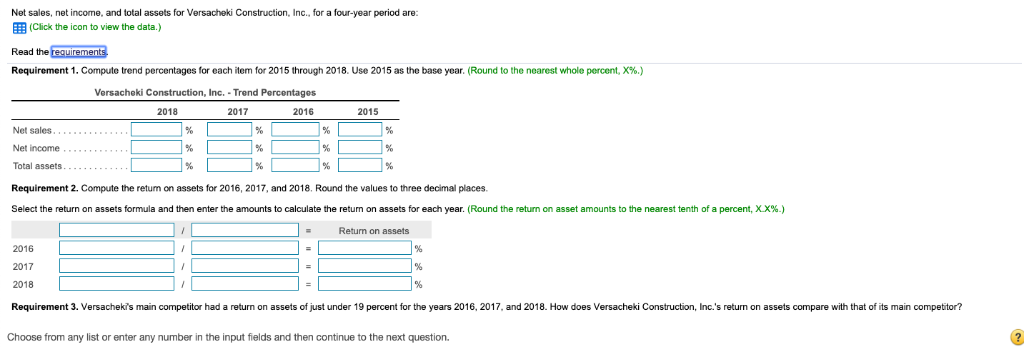
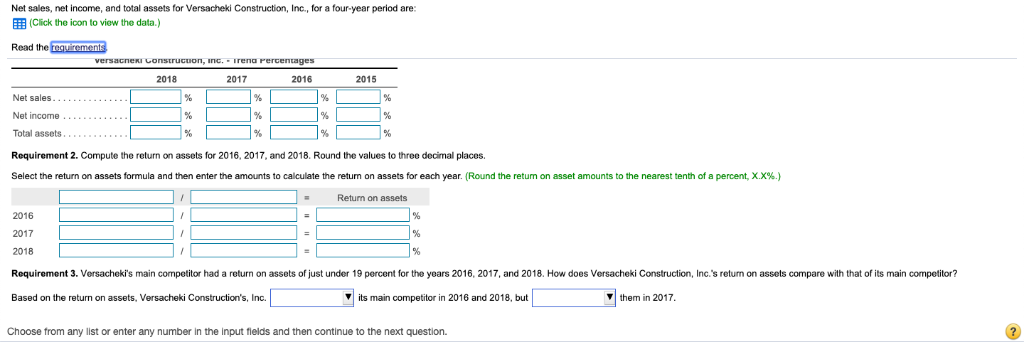
Data Table 2018 2017 2016 2015 Net sales............... $ 878,000 $ 822,000 $ 847,000 $ 831,000 Net income .............. 186,000 162,000 179,000 170,000 Ending total assets ....... 948,000 914,000 906,000 894,000 Print Print Done Requirements 1. Compute trend percentages for each item for 2015 through 2018. Use 2015 as the base year. 2. Compute the return on assets for 2016, 2017, and 2018. Round the values to three decimal places. 3. Versacheki's main competitor had a return on assets of just under 19 percent for the years 2016, 2017, and 2018. How does Versacheki Construction, Inc.'s return on assets compare with that of its main competitor? Print Print Done Net sales, net income, and total assets for Versacheki Construction, Inc., for a four-year period are: (Click the icon to view the data.) Read the requirements Requirement 1. Compute trend percentages for each item for 2015 through 2018. Use 2015 as the base year. (Round to the nearest whole percent, X%.) Versacheki Construction, Inc. - Trend Percentages 2018 2016 2017 2015 .. Net sales...... Net income ........ Total assets Requirement 2. Compute the return on assets for 2016, 2017, and 2018. Round the values to three decimal places Select the return on assets formula and then enter the amounts to calculate the return on assets for each year. (Round the return on asset amounts to the nearest tenth of a percent, XX%.) = Return on assets 2016 2017 2018 Requirement 3. Versacheki's main competitor had a return on assets of just under 19 percent for the years 2016, 2017, and 2018. How does Versacheki Construction, Inc.'s return on assets compare with that of its main competitor? Choose from any list or enter any number in the input fields and then continue to the next question. Net sales, net income, and total assets for Versacheki Construction, Inc., for a four-year period are: (Click the icon to view the data.) Read the requirements Versacer construcuon, Inc. Irena Percentages 2018 2017 2016 2015 Net sales............. Net income ........... Total assets Requirement 2. Compute the return on assets for 2016, 2017, and 2018. Round the values to three decimal places. Select the return on assets formula and then enter the amounts to calculate the return on assets for each year. (Round the retum on asset amounts to the nearest tenth of a percent, X.X%.) - Return on assets 2016 2017 2018 Requirement 3. Versacheki's main competitor had a return on assets of just under 19 percent for the years 2016, 2017, and 2018. How does Versacheki Construction, Inc.'s return on assets compare with that of its main competitor? Based on the return on assets, Versacheki Construction's, Inc. its main competitor in 2016 and 2018, but them in 2017. Choose from any list or enter any number in the input fields and then continue to the next
Step by Step Solution
There are 3 Steps involved in it

Get step-by-step solutions from verified subject matter experts