

Question: - Data table (Click on the following icon & in order to copy its contents into a spreadsheet.) FFC Portfolio Average Monthly Returns, 1927-2018 Factor
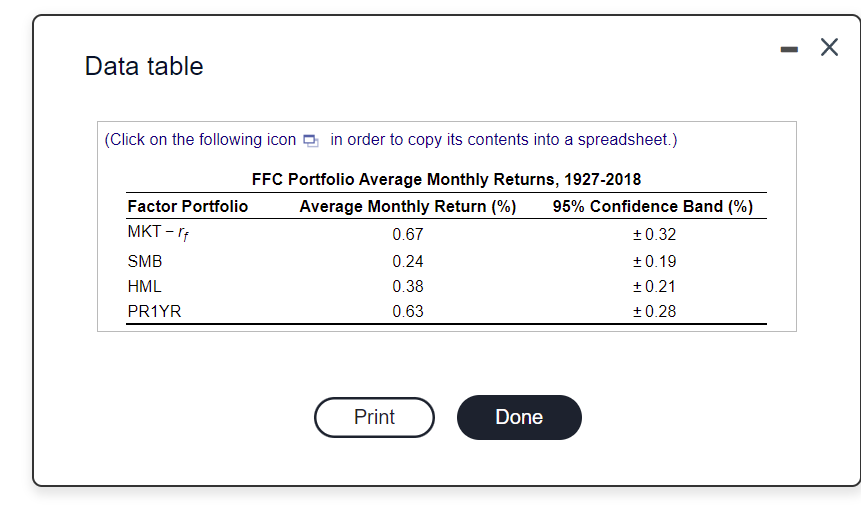
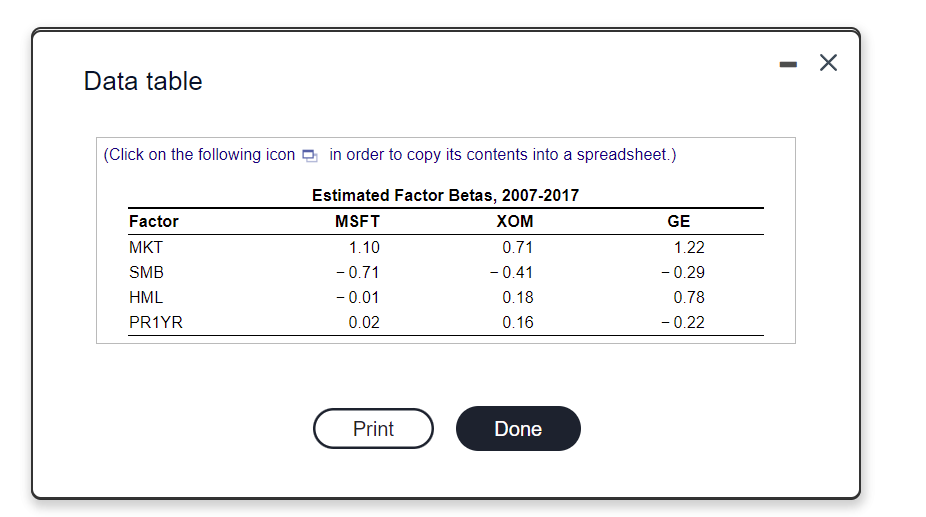

- Data table (Click on the following icon & in order to copy its contents into a spreadsheet.) FFC Portfolio Average Monthly Returns, 1927-2018 Factor Portfolio Average Monthly Return (%) 95% Confidence Band (%) MKT-rf 0.67 +0.32 SMB 0.24 + 0.19 HML 0.38 +0.21 PR1YR 0.63 +0.28 Print Done Data table (Click on the following icon in order to copy its contents into a spreadsheet.) Factor MKT SMB HML PR1YR Estimated Factor Betas, 2007-2017 MSFT XOM 1.10 0.71 -0.71 -0.41 -0.01 0.18 0.02 0.16 GE 1.22 -0.29 0.78 -0.22 Print Done You are currently considering an investment in a project in the energy sector. The investment has the same riskiness as Exxon Mobil stock (ticker: XOM). Using the data in Table 13.1 3 and the table , calculate the cost of capital using the FFC factor specification if the current risk-free rate is 3.4% per year. The cost of capital using the FFC factor specification is 1%. (Round to two decimal places.)
Step by Step Solution
There are 3 Steps involved in it

Get step-by-step solutions from verified subject matter experts