

Question: Data table (Click on the icon here e in order to copy its contents of the data table below into a spreadsheet.) B Returns Year
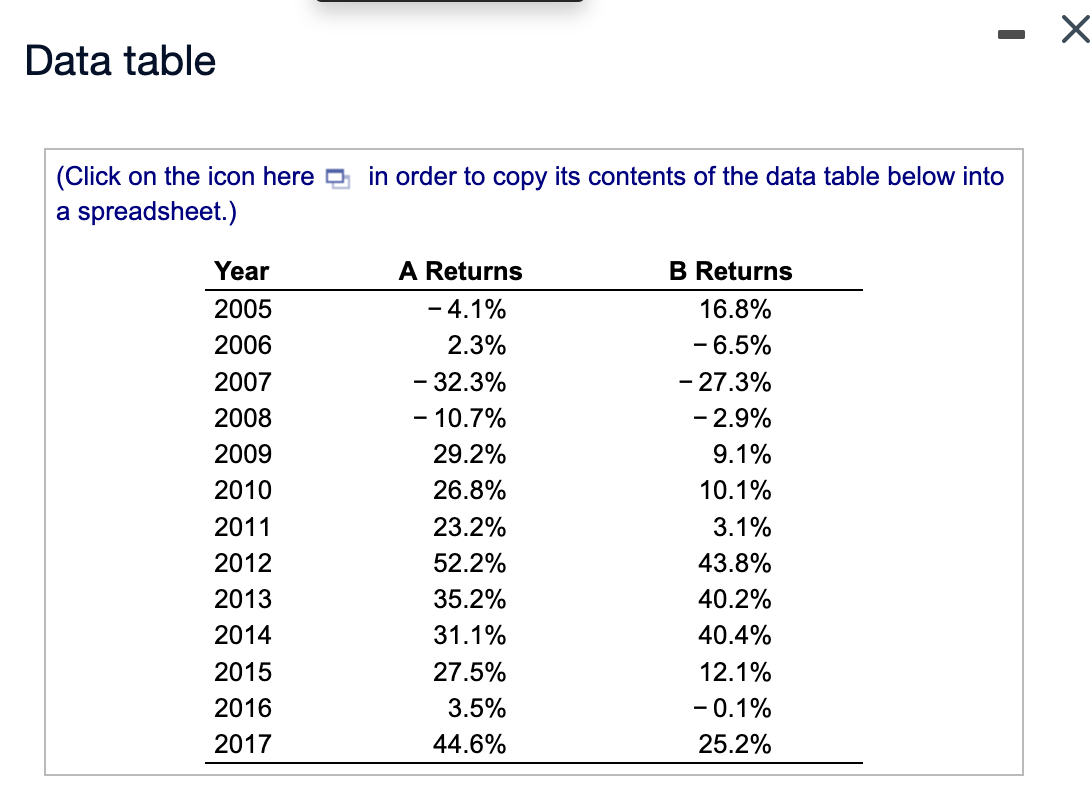
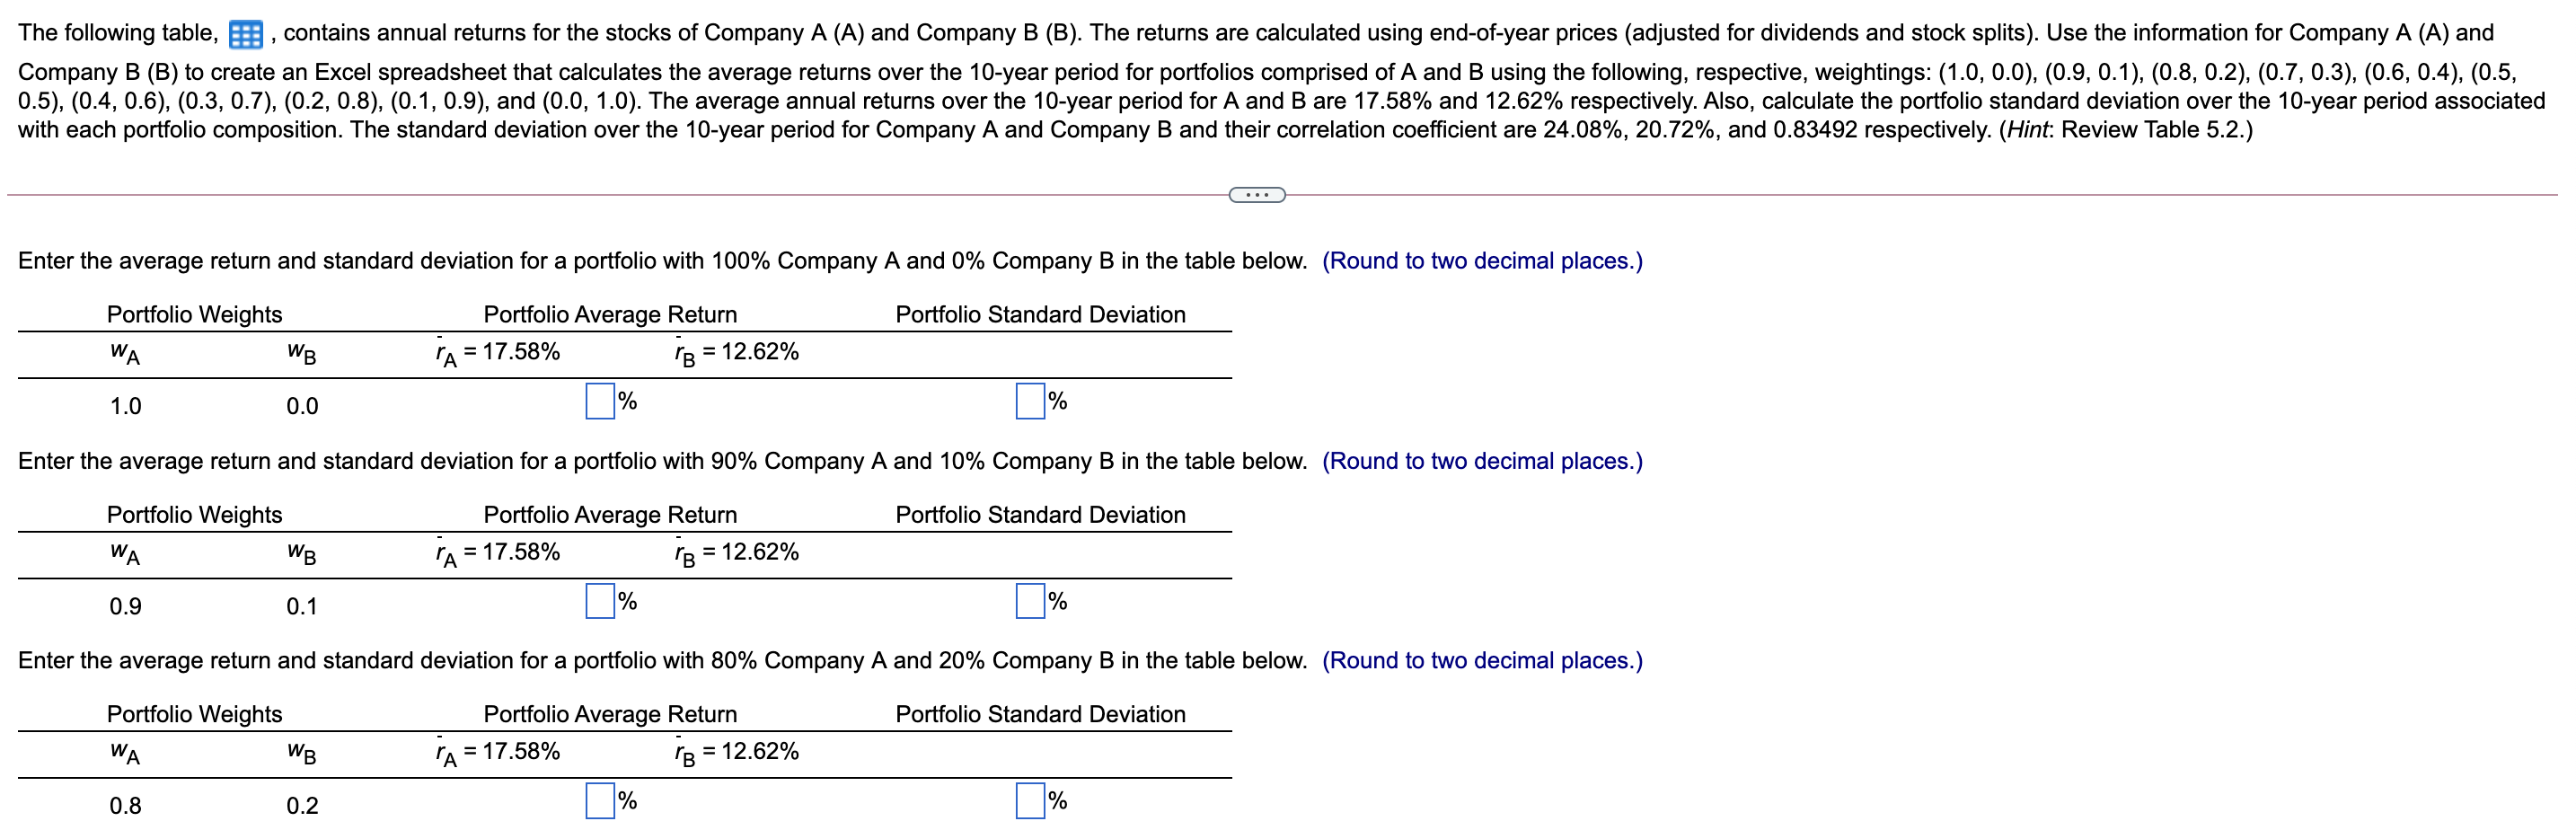
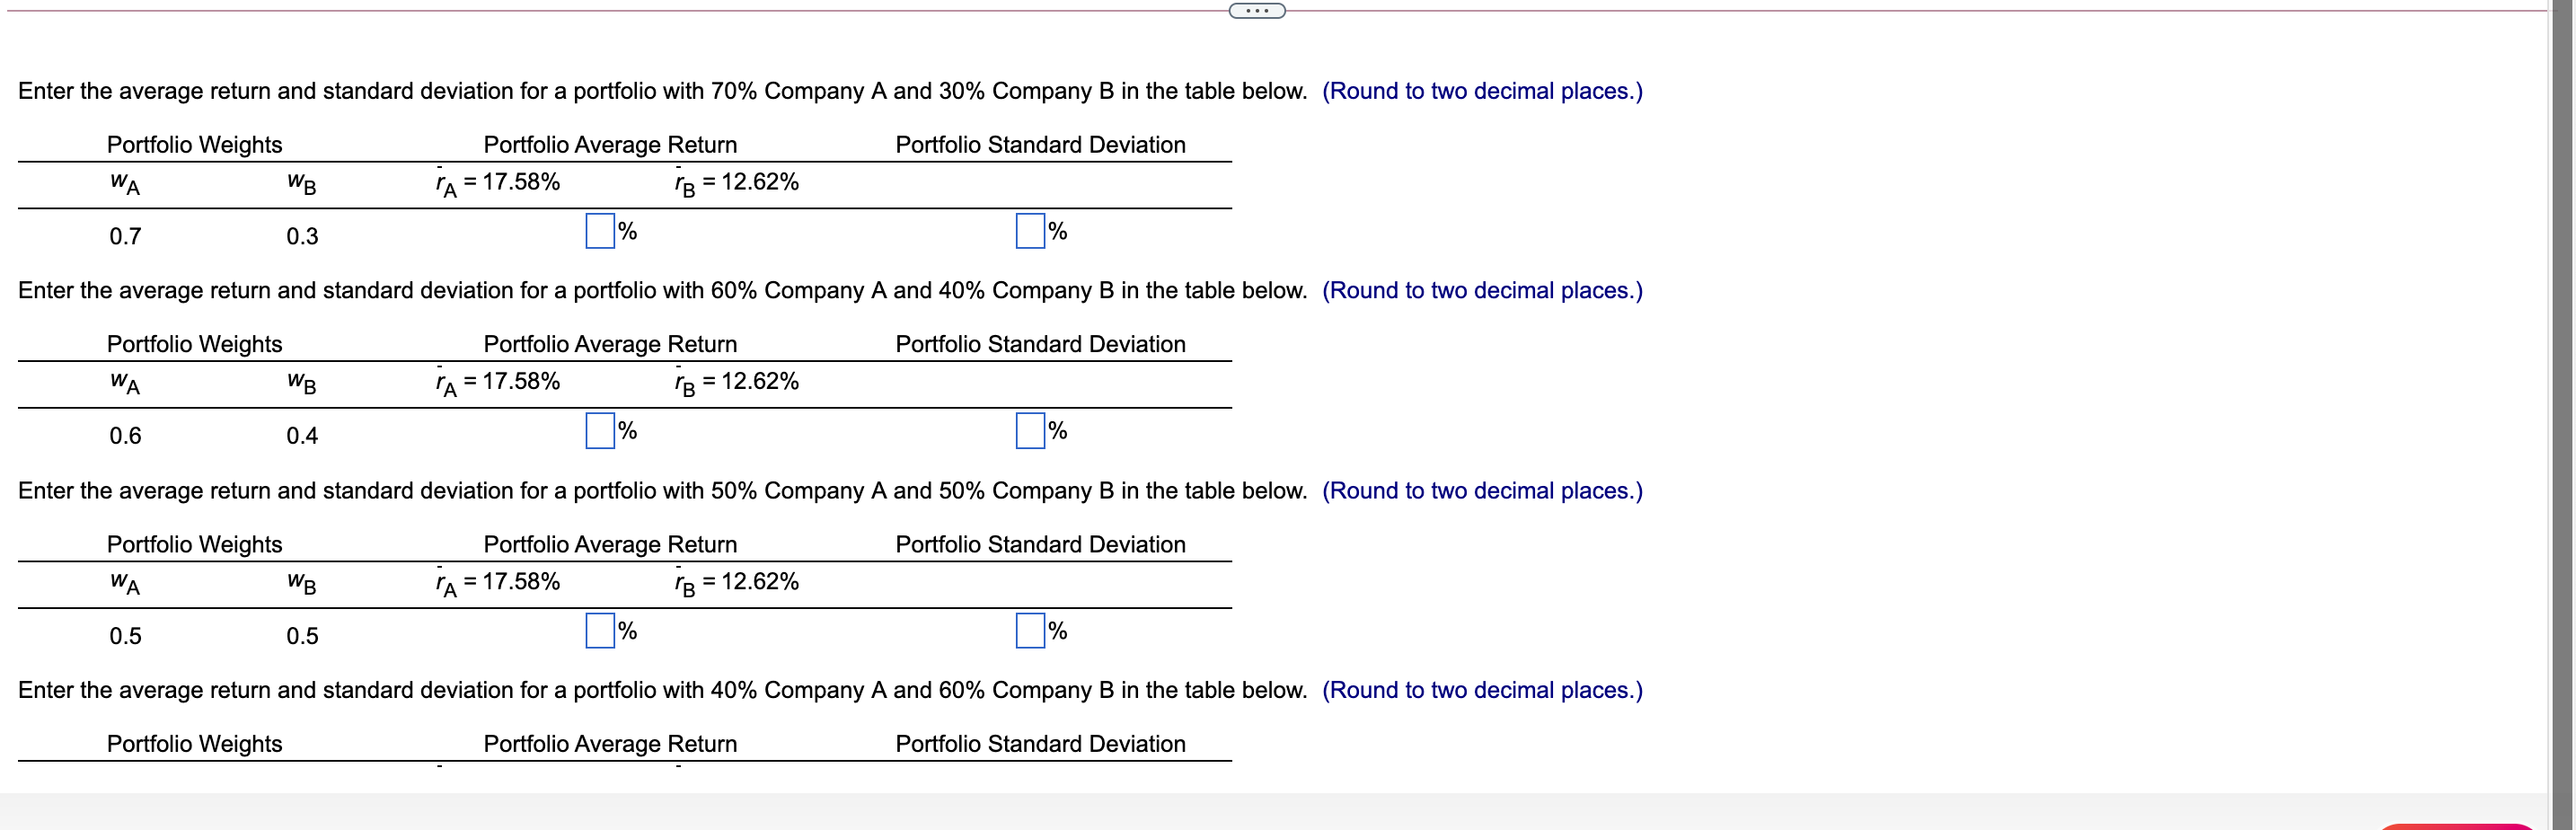
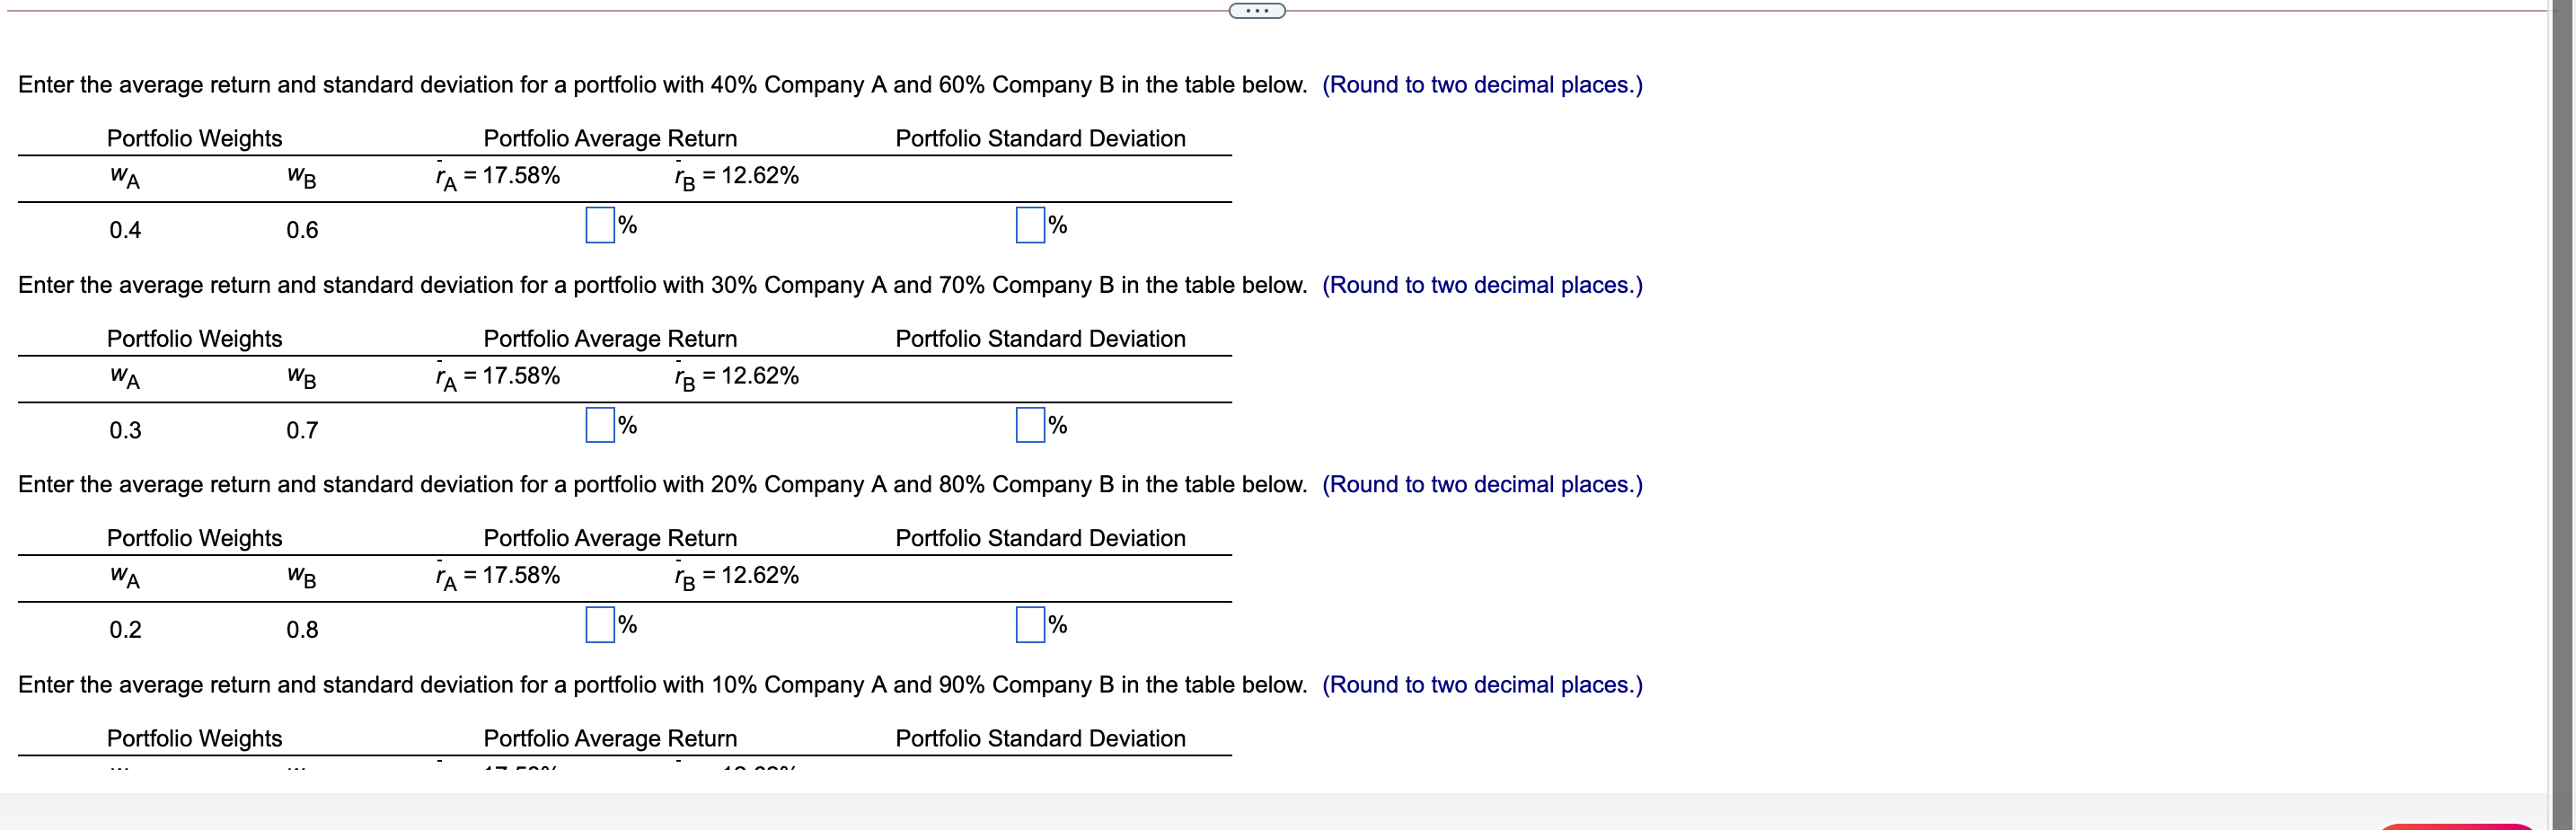
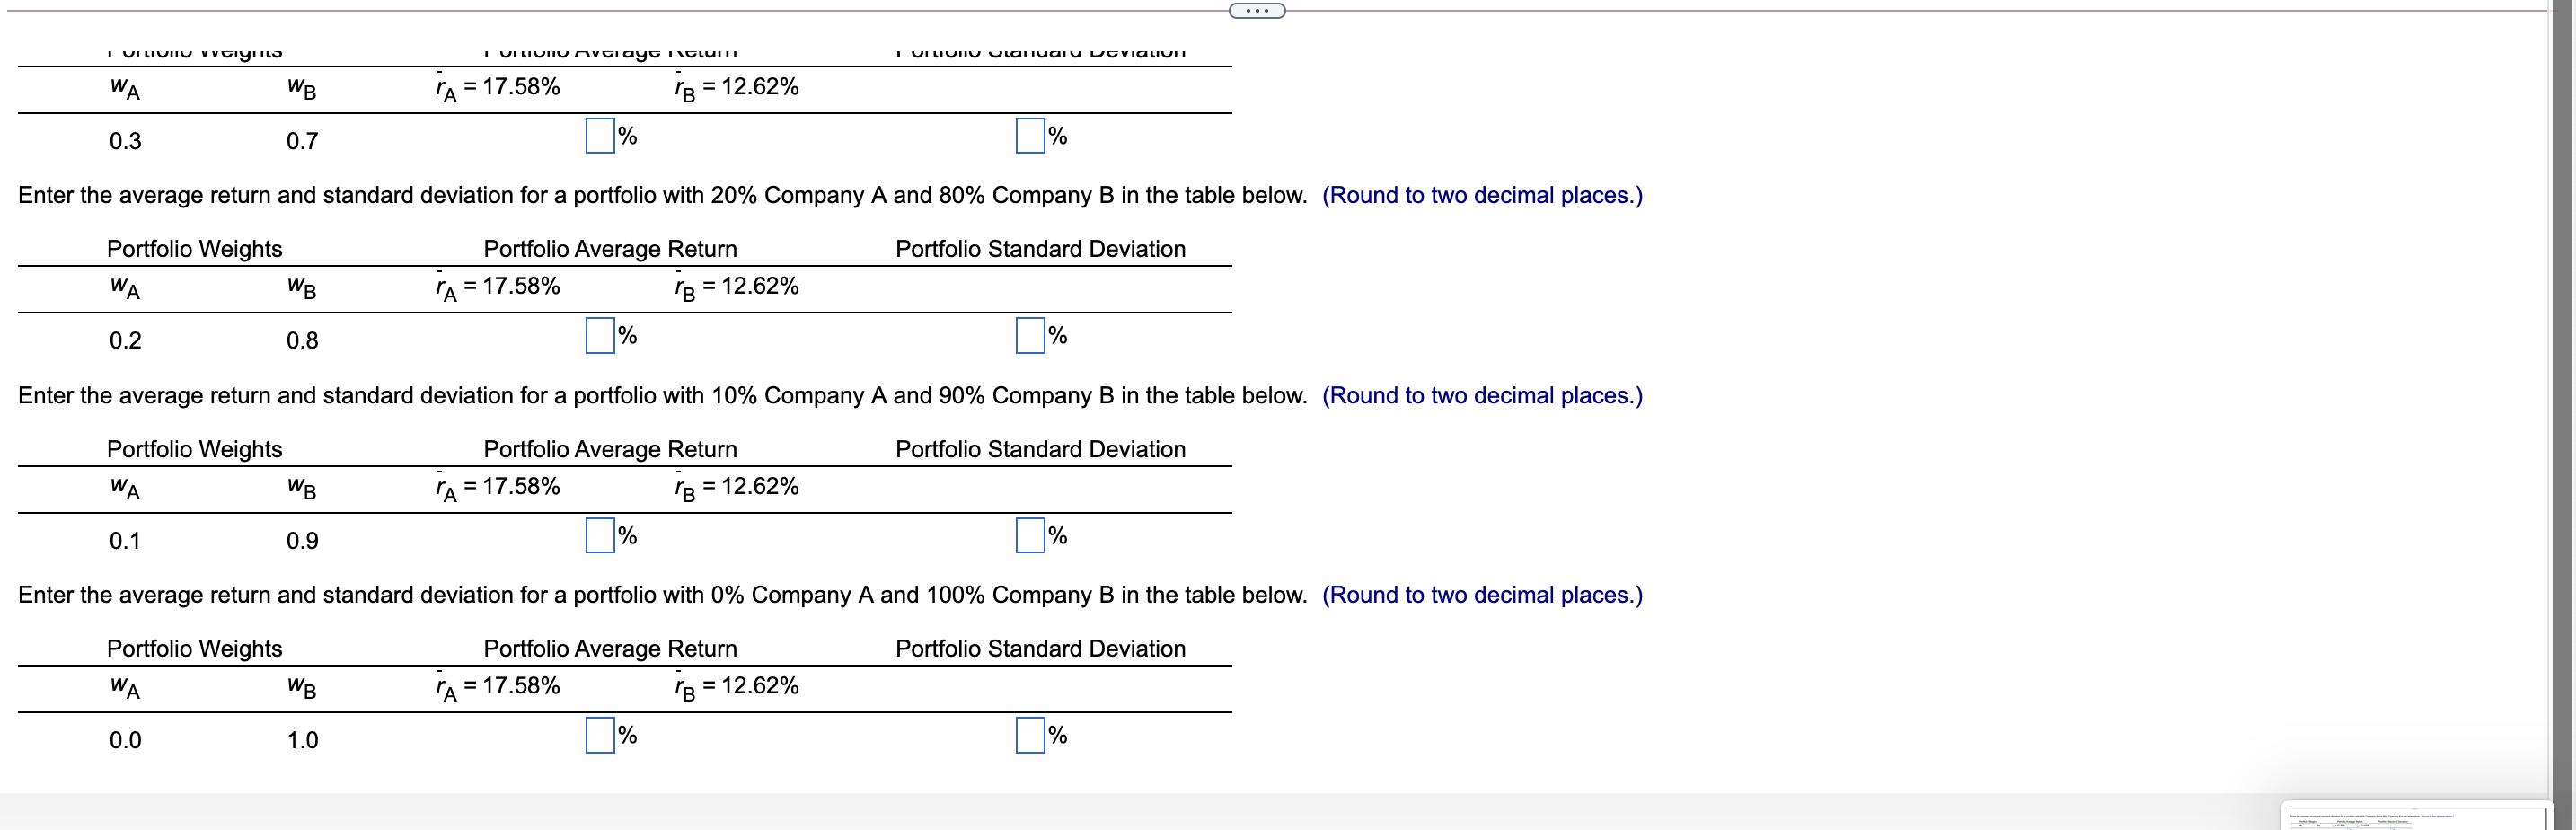
Data table (Click on the icon here e in order to copy its contents of the data table below into a spreadsheet.) B Returns Year 2005 2006 2007 2008 2009 2010 2011 2012 2013 2014 2015 2016 2017 A Returns -4.1% 2.3% - 32.3% - 10.7% 29.2% 26.8% 23.2% 52.2% 35.2% 31.1% 27.5% 3.5% 44.6% 16.8% -6.5% - 27.3% -2.9% 9.1% 10.1% 3.1% 43.8% 40.2% 40.4% 12.1% - 0.1% 25.2% The following table, E, contains annual returns for the stocks of Company A (A) and Company B (B). The returns are calculated using end-of-year prices (adjusted for dividends and stock splits). Use the information for Company A (A) and Company B (B) to create an Excel spreadsheet that calculates the average returns over the 10-year period for portfolios comprised of A and B using the following, respective, weightings: (1.0, 0.0), (0.9, 0.1), (0.8, 0.2), (0.7, 0.3), (0.6, 0.4), (0.5, 0.5), (0.4, 0.6), (0.3, 0.7), (0.2, 0.8), (0.1,0.9), and (0.0, 1.0). The average annual returns over the 10-year period for A and B are 17.58% and 12.62% respectively. Also, calculate the portfolio standard deviation over the 10-year period associated with each portfolio composition. The standard deviation over the 10-year period for Company A and Company B and their correlation coefficient are 24.08%, 20.72%, and 0.83492 respectively. (Hint: Review Table 5.2.) Enter the average return and standard deviation for a portfolio with 100% Company A and 0% Company B in the table below. (Round to two decimal places.) Portfolio Standard Deviation Portfolio Weights WA WB Portfolio Average Return PA = 17.58% BE = 12.62% 1.0 0.0 % % Enter the average return and standard deviation for a portfolio with 90% Company A and 10% Company B in the table below. (Round to two decimal places.) Portfolio Standard Deviation Portfolio Weights WA WB Portfolio Average Return "A = 17.58% PB = 12.62% = 0.9 0.1 % % Enter the average return and standard deviation for a portfolio with 80% Company A and 20% Company B in the table below. (Round to two decimal places.) Portfolio Standard Deviation Portfolio Weights WA WB Portfolio Average Return A = 17.58% = 12.62% B = 1 0.8 0.2 % % Enter the average return and standard deviation for a portfolio with 70% Company A and 30% Company B in the table below. (Round to two decimal places.) Portfolio Standard Deviation Portfolio Weights WA WB Portfolio Average Return A = 17.58% PB = 12.62% = 0.7 0.3 % % Enter the average return and standard deviation for a portfolio with 60% Company A and 40% Company B in the table below. (Round to two decimal places.) Portfolio Standard Deviation Portfolio Weights WA WB Portfolio Average Return A = 17.58% 1B = 12.62% 0.6 0.4 % % Enter the average return and standard deviation for a portfolio with 50% Company A and 50% Company B in the table below. (Round to two decimal places.) Portfolio Standard Deviation Portfolio Weights WA WB Portfolio Average Return A = 17.58% = 12.62% = 0.5 0.5 % % Enter the average return and standard deviation for a portfolio with 40% Company A and 60% Company B in the table below. (Round to two decimal places.) Portfolio Weights Portfolio Average Return Portfolio Standard Deviation Enter the average return and standard deviation for a portfolio with 40% Company A and 60% Company B in the table below. (Round to two decimal places.) Portfolio Standard Deviation Portfolio Weights WA WB Portfolio Average Return ra = 17.58% = 12.62% 0.4 0.6 Enter the average return and standard deviation for a portfolio with 30% Company A and 70% Company B in the table below. (Round to two decimal places.) Portfolio Standard Deviation Portfolio Weights WA WB Portfolio Average Return "A = 17.58% "BE = 12.62% 0.3 0.7 % % Enter the average return and standard deviation for a portfolio with 20% Company A and 80% Company B in the table below. (Round to two decimal places.) Portfolio Standard Deviation Portfolio Weights WA WB Portfolio Average Return ra= = 17.58% 1B = 12.62% 0.2 0.8 % % Enter the average return and standard deviation for a portfolio with 10% Company A and 90% Company B in the table below. (Round to two decimal places.) Portfolio Weights Portfolio Average Return Portfolio Standard Deviation I VILIUIIU VVCIYIL I VI LIVIU Avci ayer clunni I VILIVIU vlaniuaiu EviaLIVIT WA WB PA = 17.58% BE = 12.62% 0.3 0.7 1% % Enter the average return and standard deviation for a portfolio with 20% Company A and 80% Company B in the table below. (Round to two decimal places.) Portfolio Standard Deviation Portfolio Weights WA WB Portfolio Average Return AE = 17.58% 1B = 12.62% 0.2 0.8 % % Enter the average return and standard deviation for a portfolio with 10% Company A and 90% Company B in the table below. (Round to two decimal places.) Portfolio Standard Deviation Portfolio Weights WA WB Portfolio Average Return PA = 17.58% BE = 12.62% 0.1 0.9 % % Enter the average return and standard deviation for a portfolio with 0% Company A and 100% Company B in the table below. (Round to two decimal places.) Portfolio Standard Deviation Portfolio Weights WA WB Portfolio Average Return A = 17.58% 1B = 12.62% 0.0 1.0 % %
Step by Step Solution
There are 3 Steps involved in it

Get step-by-step solutions from verified subject matter experts