

Question: Data table Data table Data table b. By what percontage did net income grow each year? The nef income growth for year 2020 is %.
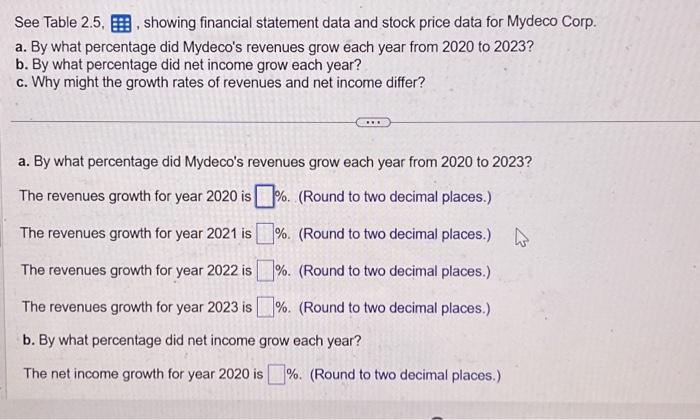
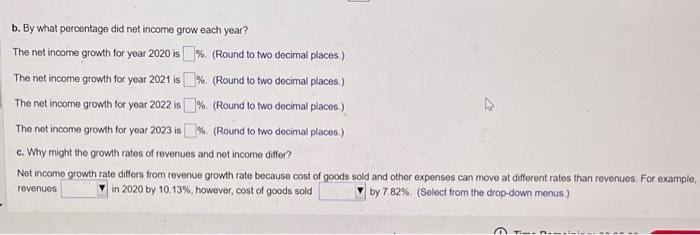
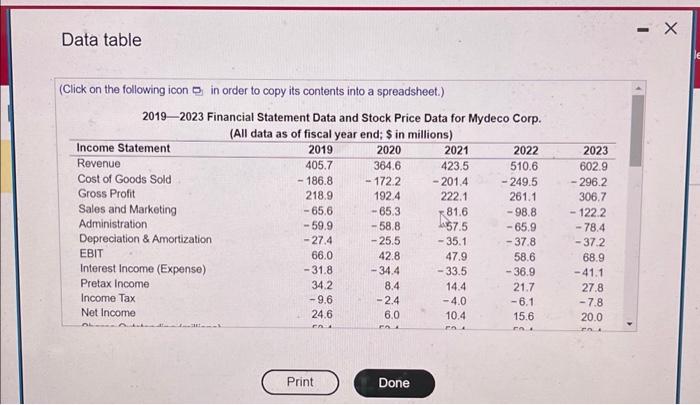
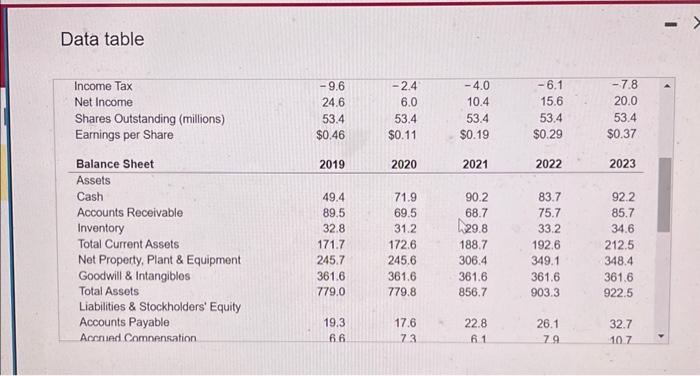
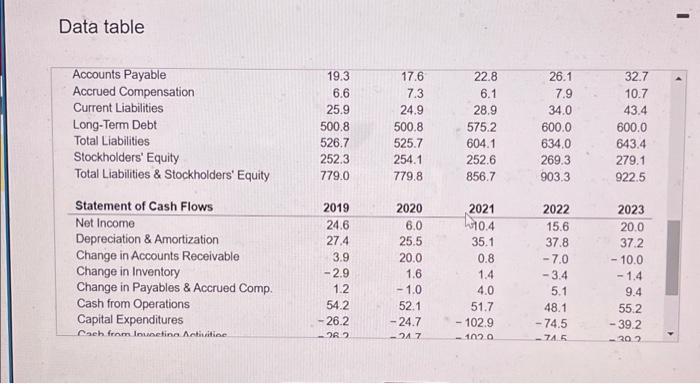
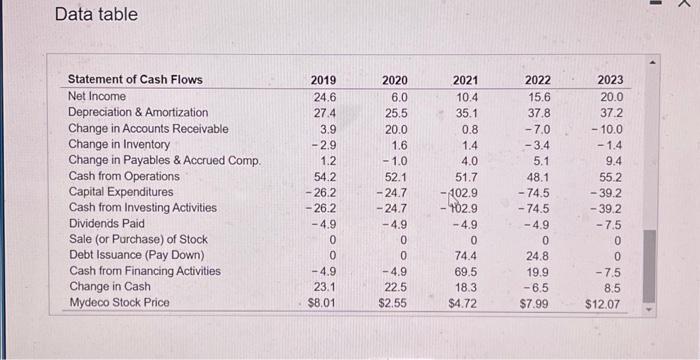
Data table Data table Data table b. By what percontage did net income grow each year? The nef income growth for year 2020 is \%. (Round to two decimal places.) The net income growth for year 2021 is \%. (Round to two decimal places.) The net income growh for yoar 2022 is %. (Round to two decimal places.) The not income growth for year 2023 is %. (Round to two decimal places.) c. Why might the growth rates of revenues and not income differ? Net income arowth rate differs from revenue growth rate because cost of goods sold and other expenses can move at different rates than revenues. For example, revenues in 2020 by 10.13%, however, cost of goods sold by 7.82%. (Select from the drop-down menus:) See Table 2.5, , showing financial statement data and stock price data for Mydeco Corp. a. By what percentage did Mydeco's revenues grow each year from 2020 to 2023 ? b. By what percentage did net income grow each year? c. Why might the growth rates of revenues and net income differ? a. By what percentage did Mydeco's revenues grow each year from 2020 to 2023 ? The revenues growth for year 2020 is \%. (Round to two decimal places.) The revenues growth for year 2021 is \%. (Round to two decimal places.) The revenues growth for year 2022 is \%. (Round to two decimal places.) The revenues growth for year 2023 is \%. (Round to two decimal places.) b. By what percentage did net income grow each year? The net income growth for year 2020 is \%. (Round to two decimal places.) Data table (Click on the following icon in order to copy its contents into a spreadsheet.) Data table Data table Data table b. By what percontage did net income grow each year? The nef income growth for year 2020 is \%. (Round to two decimal places.) The net income growth for year 2021 is \%. (Round to two decimal places.) The net income growh for yoar 2022 is %. (Round to two decimal places.) The not income growth for year 2023 is %. (Round to two decimal places.) c. Why might the growth rates of revenues and not income differ? Net income arowth rate differs from revenue growth rate because cost of goods sold and other expenses can move at different rates than revenues. For example, revenues in 2020 by 10.13%, however, cost of goods sold by 7.82%. (Select from the drop-down menus:) See Table 2.5, , showing financial statement data and stock price data for Mydeco Corp. a. By what percentage did Mydeco's revenues grow each year from 2020 to 2023 ? b. By what percentage did net income grow each year? c. Why might the growth rates of revenues and net income differ? a. By what percentage did Mydeco's revenues grow each year from 2020 to 2023 ? The revenues growth for year 2020 is \%. (Round to two decimal places.) The revenues growth for year 2021 is \%. (Round to two decimal places.) The revenues growth for year 2022 is \%. (Round to two decimal places.) The revenues growth for year 2023 is \%. (Round to two decimal places.) b. By what percentage did net income grow each year? The net income growth for year 2020 is \%. (Round to two decimal places.) Data table (Click on the following icon in order to copy its contents into a spreadsheet.)
Step by Step Solution
There are 3 Steps involved in it

Get step-by-step solutions from verified subject matter experts