

Question: Having a hard time figuring out how to do this, can someone help? See Table 2.5, , showing financial statement data and stock price data
Having a hard time figuring out how to do this, can someone help?
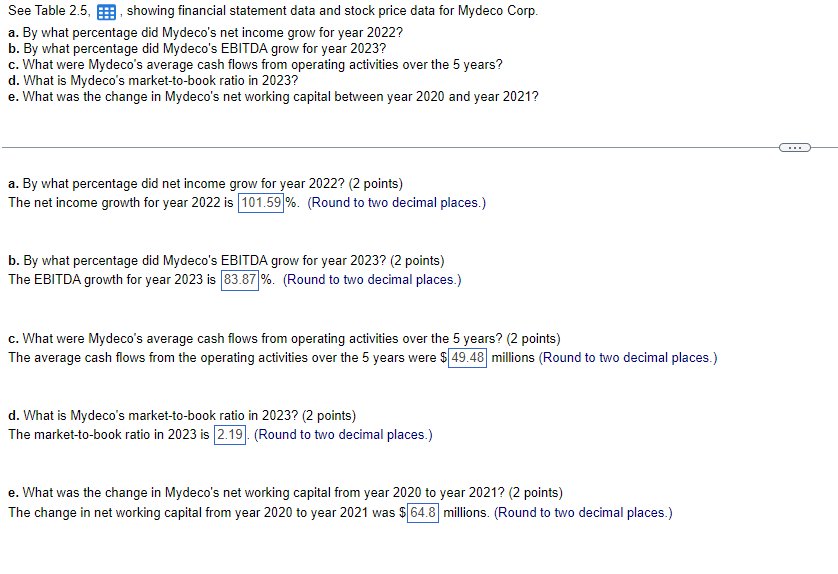
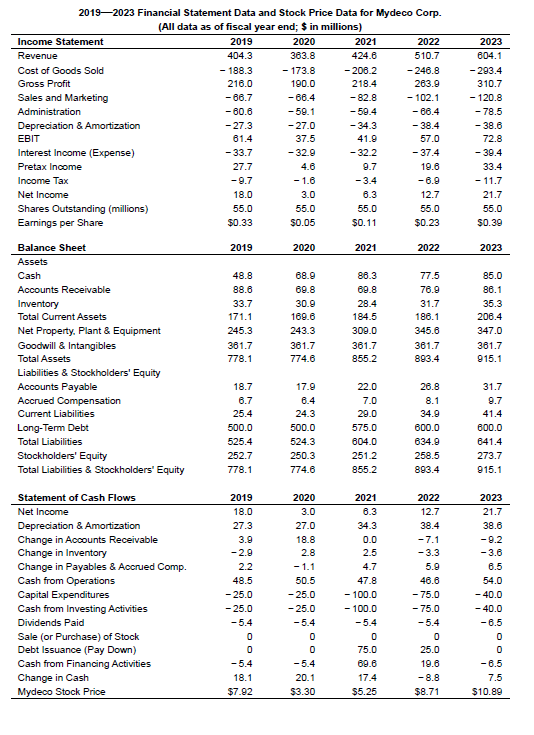
See Table 2.5, , showing financial statement data and stock price data for Mydeco Corp. a. By what percentage did Mydeco's net income grow for year 2022? b. By what percentage did Mydeco's EBITDA grow for year 2023? c. What were Mydeco's average cash flows from operating activities over the 5 years? d. What is Mydeco's market-to-book ratio in 2023? e. What was the change in Mydeco's net working capital between year 2020 and year 2021? a. By what percentage did net income grow for year 2022 ? (2 points) The net income growth for year 2022 is %. (Round to two decimal places.) b. By what percentage did Mydeco's EBITDA grow for year 2023? (2 points) The EBITDA growth for year 2023 is %. (Round to two decimal places.) c. What were Mydeco's average cash flows from operating activities over the 5 years? (2 points) The average cash flows from the operating activities over the 5 years were $ millions (Round to two decimal places.) d. What is Mydeco's market-to-book ratio in 2023 ? (2 points) The market-to-book ratio in 2023 is (Round to two decimal places.) e. What was the change in Mydeco's net working capital from year 2020 to year 2021 ? (2 points) The change in net working capital from year 2020 to year 2021 was $ millions. (Round to two decimal places.) 2019 - 2023 Financial Statement Data and Stock Price Data for Mydeco Corp. (All data as of fiscal year end; $ in millions) \begin{tabular}{|c|c|c|c|c|c|} \hline Income Statement & 2019 & 2020 & 2021 & 2022 & 2023 \\ \hline Revenue & 404.3 & 363.8 & 424.6 & 510.7 & 604.1 \\ \hline Cost of Goods Sold & -188.3 & -173.8 & -206.2 & -246.8 & -293.4 \\ \hline Gross Profit & 216.0 & 190.0 & 218.4 & 263.9 & 310.7 \\ \hline Sales and Marketing & -66.7 & -66.4 & -82.8 & -102.1 & -120.8 \\ \hline Administration & -60.6 & -59.1 & -59.4 & -66.4 & -78.5 \\ \hline Depreciation \& Amortization & -27.3 & -27.0 & -34.3 & -38.4 & -38.6 \\ \hline EBIT & 61.4 & 37.5 & 41.9 & 57.0 & 72.8 \\ \hline Interest Income (Expense) & -33.7 & -32.9 & -32.2 & -37.4 & -39.4 \\ \hline Pretax Income & 27.7 & 4.6 & 9.7 & 19.6 & 33.4 \\ \hline Income Tax & -9.7 & -1.6 & -3.4 & -6.9 & -11.7 \\ \hline Net Income & 18.0 & 3.0 & 6.3 & 12.7 & 21.7 \\ \hline Shares Outstanding (millions) & 55.0 & 55.0 & 55.0 & 55.0 & 55.0 \\ \hline Earnings per Share & $0.33 & $0.05 & $0.11 & $0.23 & $0.39 \\ \hline Balance Sheet & 2019 & 2020 & 2021 & 2022 & 2023 \\ \hline \multicolumn{6}{|l|}{ Assets } \\ \hline Cash & 48.8 & 68.9 & 86.3 & 77.5 & 85.0 \\ \hline Accounts Receivable & 88.6 & 69.8 & 69.8 & 76.9 & 86.1 \\ \hline Inventory & 33.7 & 30.9 & 28.4 & 31.7 & 35.3 \\ \hline Total Current Assets & 171.1 & 169.6 & 184.5 & 186.1 & 206.4 \\ \hline Net Property. Plant \& Equipment & 245.3 & 243.3 & 309.0 & 345.6 & 347.0 \\ \hline Goodwill \& Intangibles & 361.7 & 361.7 & 361.7 & 361.7 & 361.7 \\ \hline Total Assets & 778.1 & 774.6 & 855.2 & 893.4 & 915.1 \\ \hline \multicolumn{6}{|l|}{ Liabilities \& Stockholders' Equity } \\ \hline Accounts Payable & 18.7 & 17.9 & 22.0 & 26.8 & 31.7 \\ \hline Accrued Compensation & 6.7 & 6.4 & 7.0 & 8.1 & 9.7 \\ \hline Current Liabilities & 25.4 & 24.3 & 29.0 & 34.9 & 41.4 \\ \hline Long-Term Debt & 500.0 & 500.0 & 575.0 & 600.0 & 600.0 \\ \hline Total Liabilities & 525.4 & 524.3 & 604.0 & 634.9 & 641.4 \\ \hline Stockholders' Equity & 252.7 & 250.3 & 251.2 & 258.5 & 273.7 \\ \hline Total Liabilities \& Stockholders' Equity & 778.1 & 774.6 & 855.2 & 893.4 & 915.1 \\ \hline Statement of Cash Flows & 2019 & 2020 & 2021 & 2022 & 2023 \\ \hline Net Income & 18.0 & 3.0 & 6.3 & 12.7 & 21.7 \\ \hline Depreciation \& Amortization & 27.3 & 27.0 & 34.3 & 38.4 & 38.6 \\ \hline Change in Accounts Receivable & 3.9 & 18.8 & 0.0 & -7.1 & -9.2 \\ \hline Change in Inventory & -2.9 & 2.8 & 2.5 & -3.3 & -3.6 \\ \hline Change in Payables \& Accrued Comp. & 2.2 & -1.1 & 4.7 & 5.9 & 6.5 \\ \hline Cash from Operations & 48.5 & 50.5 & 47.8 & 46.6 & 54.0 \\ \hline Capital Expenditures & -25.0 & -25.0 & -100.0 & -75.0 & -40.0 \\ \hline Cash from Investing Activities & -25.0 & -25.0 & -100.0 & -75.0 & -40.0 \\ \hline Dividends Paid & -5.4 & -5.4 & -5.4 & -5.4 & -6.5 \\ \hline Sale (or Purchase) of Stock & 0 & 0 & 0 & 0 & 0 \\ \hline Debt Issuance (Pay Down) & 0 & 0 & 75.0 & 25.0 & 0 \\ \hline Cash from Financing Activities & -5.4 & -5.4 & 69.6 & 19.6 & -6.5 \\ \hline Change in Cash & 18.1 & 20.1 & 17.4 & -8.8 & 7.5 \\ \hline Mydeco Stock Price & $7.92 & $3.30 & $5.25 & $8.71 & $10.89 \\ \hline \end{tabular}
Step by Step Solution
There are 3 Steps involved in it

Get step-by-step solutions from verified subject matter experts