

Question: Data table Height, x IQ score, y 62 102 60 94 67 101 69 105 60 87 64 101 65 113 56 121(a) Display the


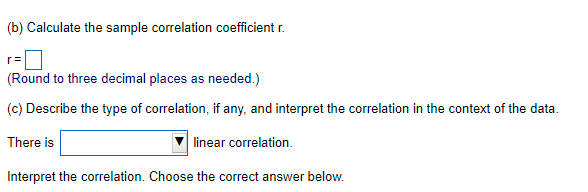

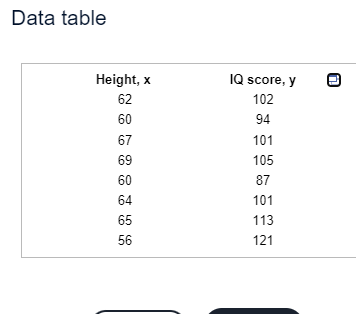
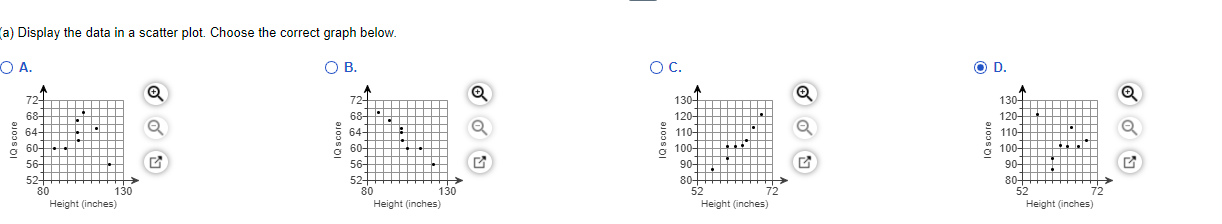

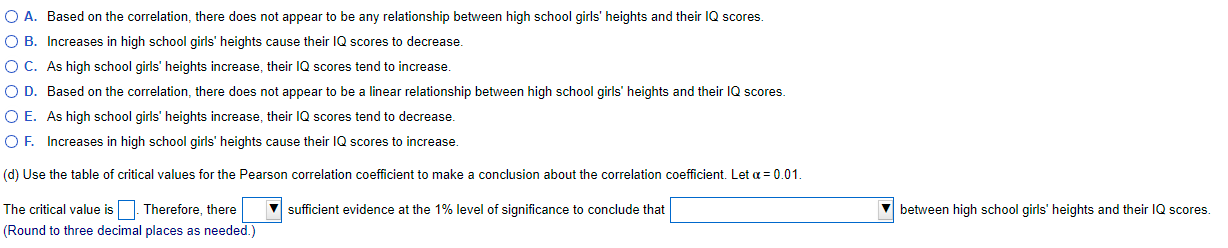
Data table Height, x IQ score, y 62 102 60 94 67 101 69 105 60 87 64 101 65 113 56 121(a) Display the data in a scatter plot. Choose the correct graph below. O A. O B. O C. OD. 72- 72- O 130- 68- 130- 68- 120 64- 120 64- 1Q score Q score 110- 110 1Q score 60- 1Q score 100- 56- 100- 56- 90- 52- 90- 52 80 130 80HH 80 130 52 72 80+ Height (inches) 52 72 Height (inches) Height (inches) Height (inches)(b) Calculate the sample correlation coefficient r. (Round to three decimal places as needed.) (c) Describe the type of correlation, if any, and interpret the correlation in the context of the data. There is linear correlation. Interpret the correlation. Choose the correct answer below.O A. Based on the correlation, there does not appear to be any relationship between high school girls' heights and their IQ scores. O B. Increases in high school girls' heights cause their IQ scores to decrease. O C. As high school girls' heights increase, their IQ scores tend to increase. O D. Based on the correlation, there does not appear to be a linear relationship between high school girls' heights and their IQ scores. O E. As high school girls' heights increase, their IQ scores tend to decrease. O F. Increases in high school girls' heights cause their IQ scores to increase. (d) Use the table of critical values for the Pearson correlation coefficient to make a conclusion about the correlation coefficient. Let a = 0.01. The critical value is . Therefore, there sufficient evidence at the 1% level of significance to conclude that between high school girls' heights and their IQ scores. Round to three decimal places as needed.)
Step by Step Solution
There are 3 Steps involved in it

Get step-by-step solutions from verified subject matter experts