

Question: Data table Hooser, Inc. Comparative Income Statement Years Ended December 31, 2018 and 2017 2018 2017 $ 500,000 $ 439,500 Revenue Expenses: Cost of goods
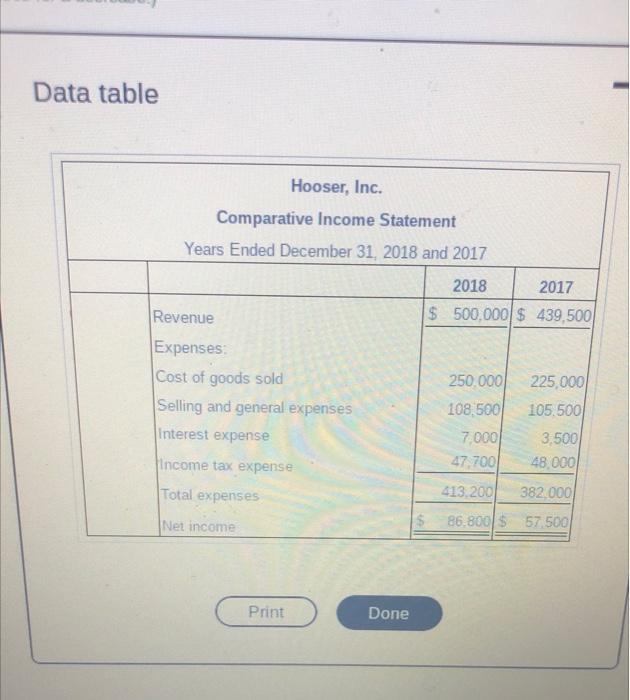
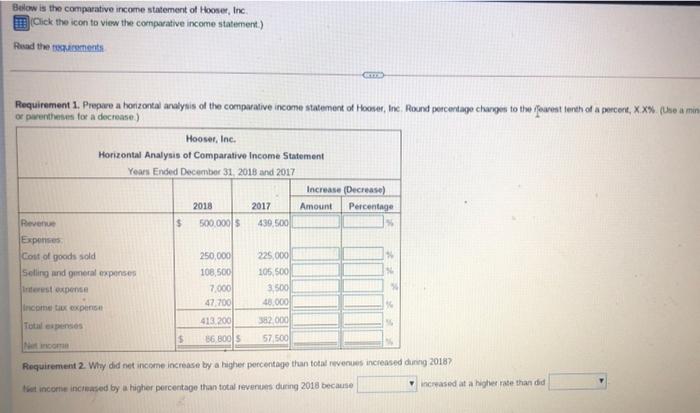
Data table Hooser, Inc. Comparative Income Statement Years Ended December 31, 2018 and 2017 2018 2017 $ 500,000 $ 439,500 Revenue Expenses: Cost of goods sold 250.000 225,000 Selling and general expenses 108,500 105.500 Interest expense 7.000 3.500 Income tax expense 47,700 48.000 Total expenses 413.200 382 000 86.800 $ 57.500 Net income Print Done Below is the comparative income statement of Hoover, Inc Click the icon to view the comparative income statement.) Read the same G Requirement 1. Prepare a horizontal analysis of the comparative income statement of Hooser, Inc Round percentage charges to the forest tenth of a percent, XX% (who a min or pentheses for a decrease) Hooser, Inc. Horizontal Analysis of Comparative Income Statement Years Ended December 31, 2018 and 2017 Increase (Decrease) 2018 2017 Amount Percentage Revenue $ 500,000 $ 439,500 Expenses Cost of goods sold 250,000 225,000 Selling and general expenses 108,500 105.500 Interest expense 7,000 3.500 come to compensa 47,700 48.000 413 200 Total expenses 2.000 56 800 57 500 income Requirement 2. Why did not income increase by a higher percentage than total revenues increased dunng 2018 e income increased by a higher percentage than total revenues during 2018 because increased at a higher rate than did
Step by Step Solution
There are 3 Steps involved in it

Get step-by-step solutions from verified subject matter experts