

Question: McClane Designs, Inc. Comparative Income Statement Years Ended December 31, 2018 and 2017 2018 2017 $ 432,000 $ 373,750 Net Sales Revenue Expenses: Cost of
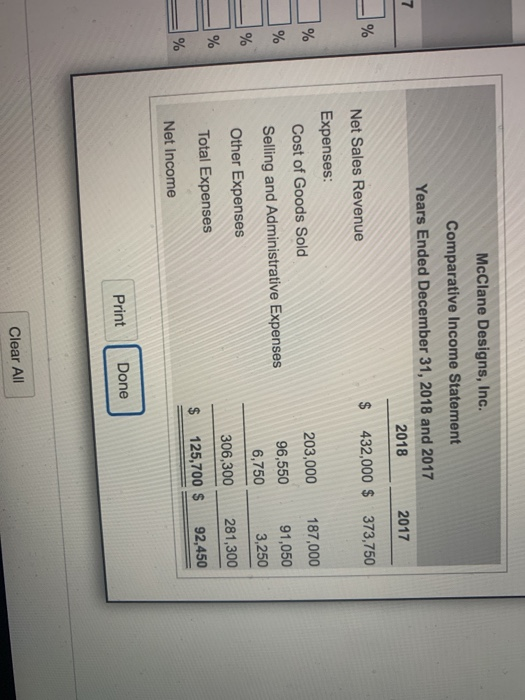
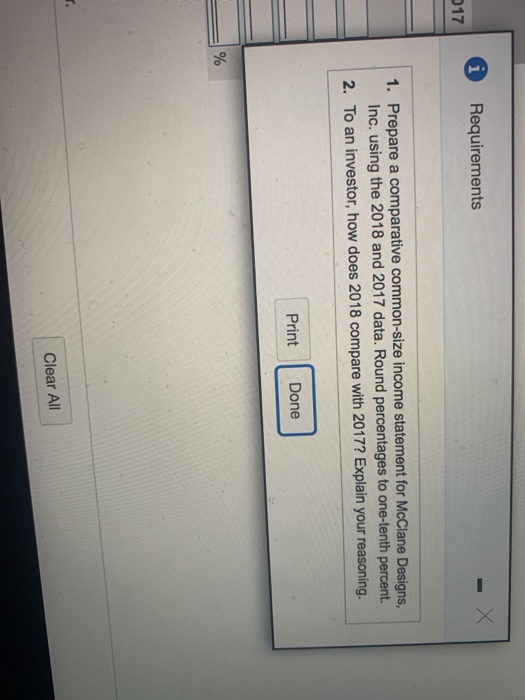
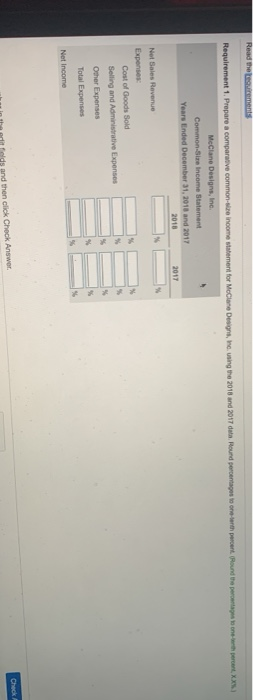
McClane Designs, Inc. Comparative Income Statement Years Ended December 31, 2018 and 2017 2018 2017 $ 432,000 $ 373,750 Net Sales Revenue Expenses: Cost of Goods Sold Selling and Administrative Expenses Other Expenses 203,000 96,550 6,750 306,300 125,700 $ 187,000 91,050 3,250 281,300 92,450 Total Expenses Net Income Print Done Clear All i Requirements 17 1. Prepare a comparative common-size income statement for McClane Designs, Inc. using the 2018 and 2017 data. Round percentages to one-tenth percent. 2. To an investor, how does 2018 compare with 2017? Explain your reasoning. Print Done Clear All Read the besirements percent XXX Requirement 1. Prepare a compare common income Matement for Meclame Designs, housing the 2018 and 2017 data Round percentages to one oth percent Hound the percentagestone McClane Designs, Inc Common Size Income Statement Years Ended December 31, 2018 and 2017 2018 Not Sales Revenue Expenses Cost of Goods Sold Selling and Administrative Expenses Other Expenses Total Expenses Net Income Check the folds and then click Check
Step by Step Solution
There are 3 Steps involved in it

Get step-by-step solutions from verified subject matter experts