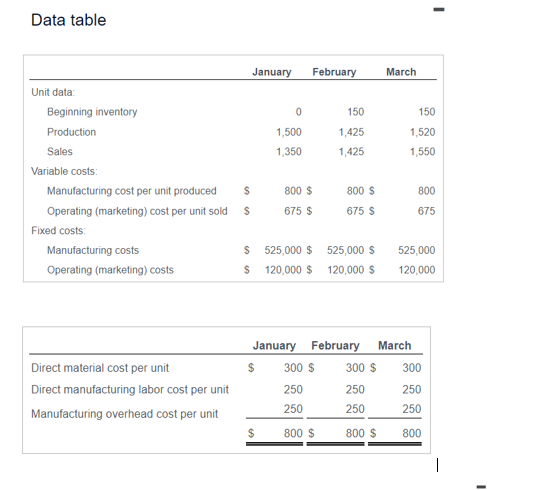
Question: Data table January February March Unit data: Beginning inventory 150 150 Production 1,500 1,425 1,520 Sales 1,350 1,425 1,550 Variable costs: Manufacturing cost per unit
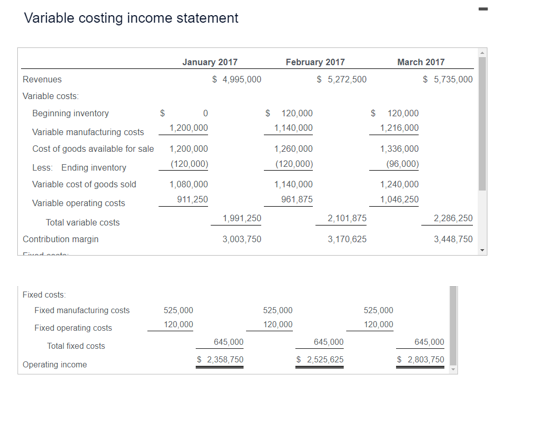
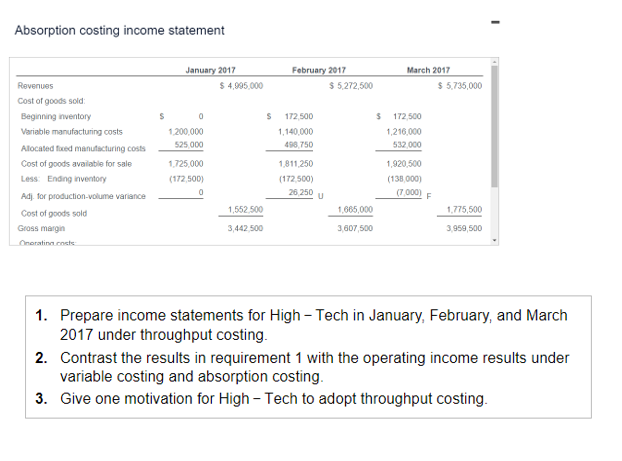
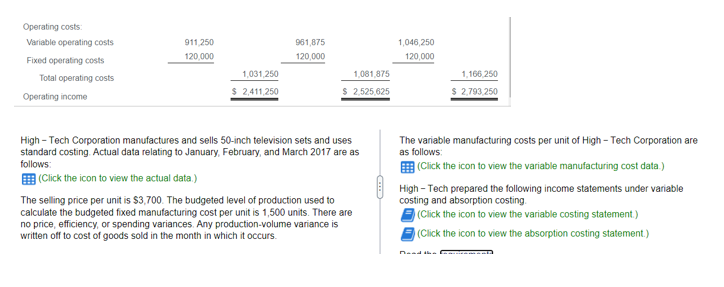
Data table January February March Unit data: Beginning inventory 150 150 Production 1,500 1,425 1,520 Sales 1,350 1,425 1,550 Variable costs: Manufacturing cost per unit produced 800 $ 800 $ 800 Operating (marketing) cost per unit sold $ 675 $ 675 $ 675 Fixed costs: Manufacturing costs S 525,000 $ 525,000 5 525,000 Operating (marketing) costs $ 120,000 $ 120,000 $ 120,000 January February March Direct material cost per unit $ 300 S 300 $ 300 Direct manufacturing labor cost per unit 250 250 250 Manufacturing overhead cost per unit 250 250 250 $ 800 $ 800 $ 800Variable costing income statement January 2017 February 2017 March 2017 Revenues $ 4,995,000 $ 5,272,500 $ 5,735,000 Variable costs: Beginning inventory $ 120,000 $ 120.000 Variable manufacturing costs 1,200,000 1,140.000 1,216,000 Cost of goods available for sale 1,200,000 1.260.000 1,336,000 Less: Ending inventory (120,000) (120,000) (86,000) Variable cost of goods sold 1,080,000 1,140,000 1,240,000 Variable operating costs 911, 250 961 875 1,046 250 Total variable costs 1,991,250 2,101 875 2 286 250 Contribution margin 3,003,750 3 170 625 3.448 750 Fixed costs Fixed manufacturing costs 525,000 525,000 525,000 Fixed operating costs 120,000 120.000 120,000 Total fixed costs 645,000 645,000 645,000 $ 2 358,750 $ 2.525.625 Operating income $ 2,803,750Absorption costing income statement January 2017 February 2017 March 2017 Revenues $ 4,905,000 $ 5.272,500 $ 5.735,000 Cost of goods sold: Beginning inventory S $ 172,500 172 500 Variable manufacturing costs 1 200,000 1,140,000 1,216.000 Allocated fied manufacturing costs 525 000 498 750 532,000 Cost of goods available for sale 1,725,000 1.811 250 1,920 500 Less: Ending Inventory (172,500] [172 500) (138,000) Adj. for production-volume variance 26 250 (7.000) Cost of goods sold 1,552 500 1.685.000 1.775,500 Gross margin 3,442 500 3,607,500 3.959,500 1. Prepare income statements for High - Tech in January, February, and March 2017 under throughput costing. 2. Contrast the results in requirement 1 with the operating income results under variable costing and absorption costing. 3. Give one motivation for High - Tech to adopt throughput costing.Operating costs: Variable operating costs 911 250 981,875 1,046,250 Fixed operating costs 120.000 120,000 120,000 Total operating costs 1,031,250 1,081 875 1.166 250 Operating income $ 2,411,250 $ 2 525 625 $ 2 793 250 High - Tech Corporation manufactures and sells 50-inch television sets and uses The variable manufacturing costs per unit of High - Tech Corporation are standard costing. Actual data relating to January, February, and March 2017 are as as follows: follows: (Click the icon to view the variable manufacturing cost data.) (Click the icon to view the actual data.) High - Tech prepared the following income statements under variable The selling price per unit is $3,700. The budgeted level of production used to costing and absorption costing. calculate the budgeted fixed manufacturing cost per unit is 1,500 units. There are (Click the icon to view the variable costing statement.) no price, efficiency, or spending variances, Any production-volume variance is written off to cost of goods sold in the month in which it occurs. (Click the icon to view the absorption costing statement.) naed ibs boom boom
Step by Step Solution
There are 3 Steps involved in it
1 Expert Approved Answer
Step: 1 Unlock
Question Has Been Solved by an Expert!
Get step-by-step solutions from verified subject matter experts
Step: 2 Unlock
Step: 3 Unlock
Students Have Also Explored These Related Accounting Questions!