

Question: Data Table McClane Designs, Inc. Comparative Income Statement Years Ended December 31, 2018 and 2017 2018 -ase ent 2017 $ 428,000 $ 375,750 Net Sales
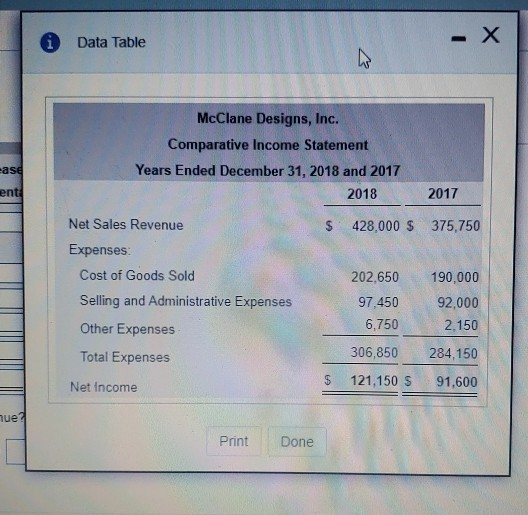

Data Table McClane Designs, Inc. Comparative Income Statement Years Ended December 31, 2018 and 2017 2018 -ase ent 2017 $ 428,000 $ 375,750 Net Sales Revenue Expenses: Cost of Goods Sold Selling and Administrative Expenses Other Expenses Total Expenses 190,000 92,000 202.650 97.450 6,750 306,850 121,150 S 2.150 284,150 91,600 $ Net Income nue? Print Done Data for McClane Designs, Inc. follow E: (Click the icon to view the data.) Read the requirements TE LIVELLO 12 VE Increase (Decrease) Amount Percentage 2018 428,000 2017 375,750 $ Net Sales Revenue Expenses Cost of Goods Sold Selling and Administrative Expenses Other Expenses 202,650 97,450 6,750 306,850 121,150 $ 190,000 92,000 2,150 284.150 91,600 Total Expenses Net Income Requirement 2. Why did 2018 net income increase by a higher percentage than net sales revenue? Net income increased by a higher percentage than total net sales revenue during 2018 because Enter any number in the edit fields and then continue to the next
Step by Step Solution
There are 3 Steps involved in it

Get step-by-step solutions from verified subject matter experts