

Question: Data table Men Full Data Set Centimeters Centimeters Centimeters Centimeters (measured) (believed) (measured) (believed) 167 167.64 177 180.34 170 170.18 179 177.80 183 187.96 183
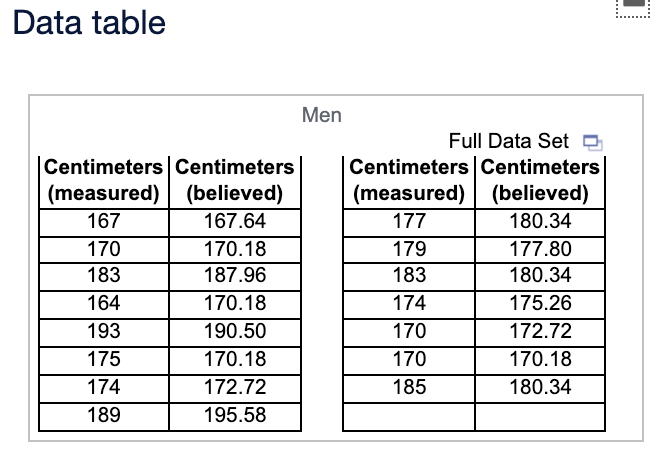
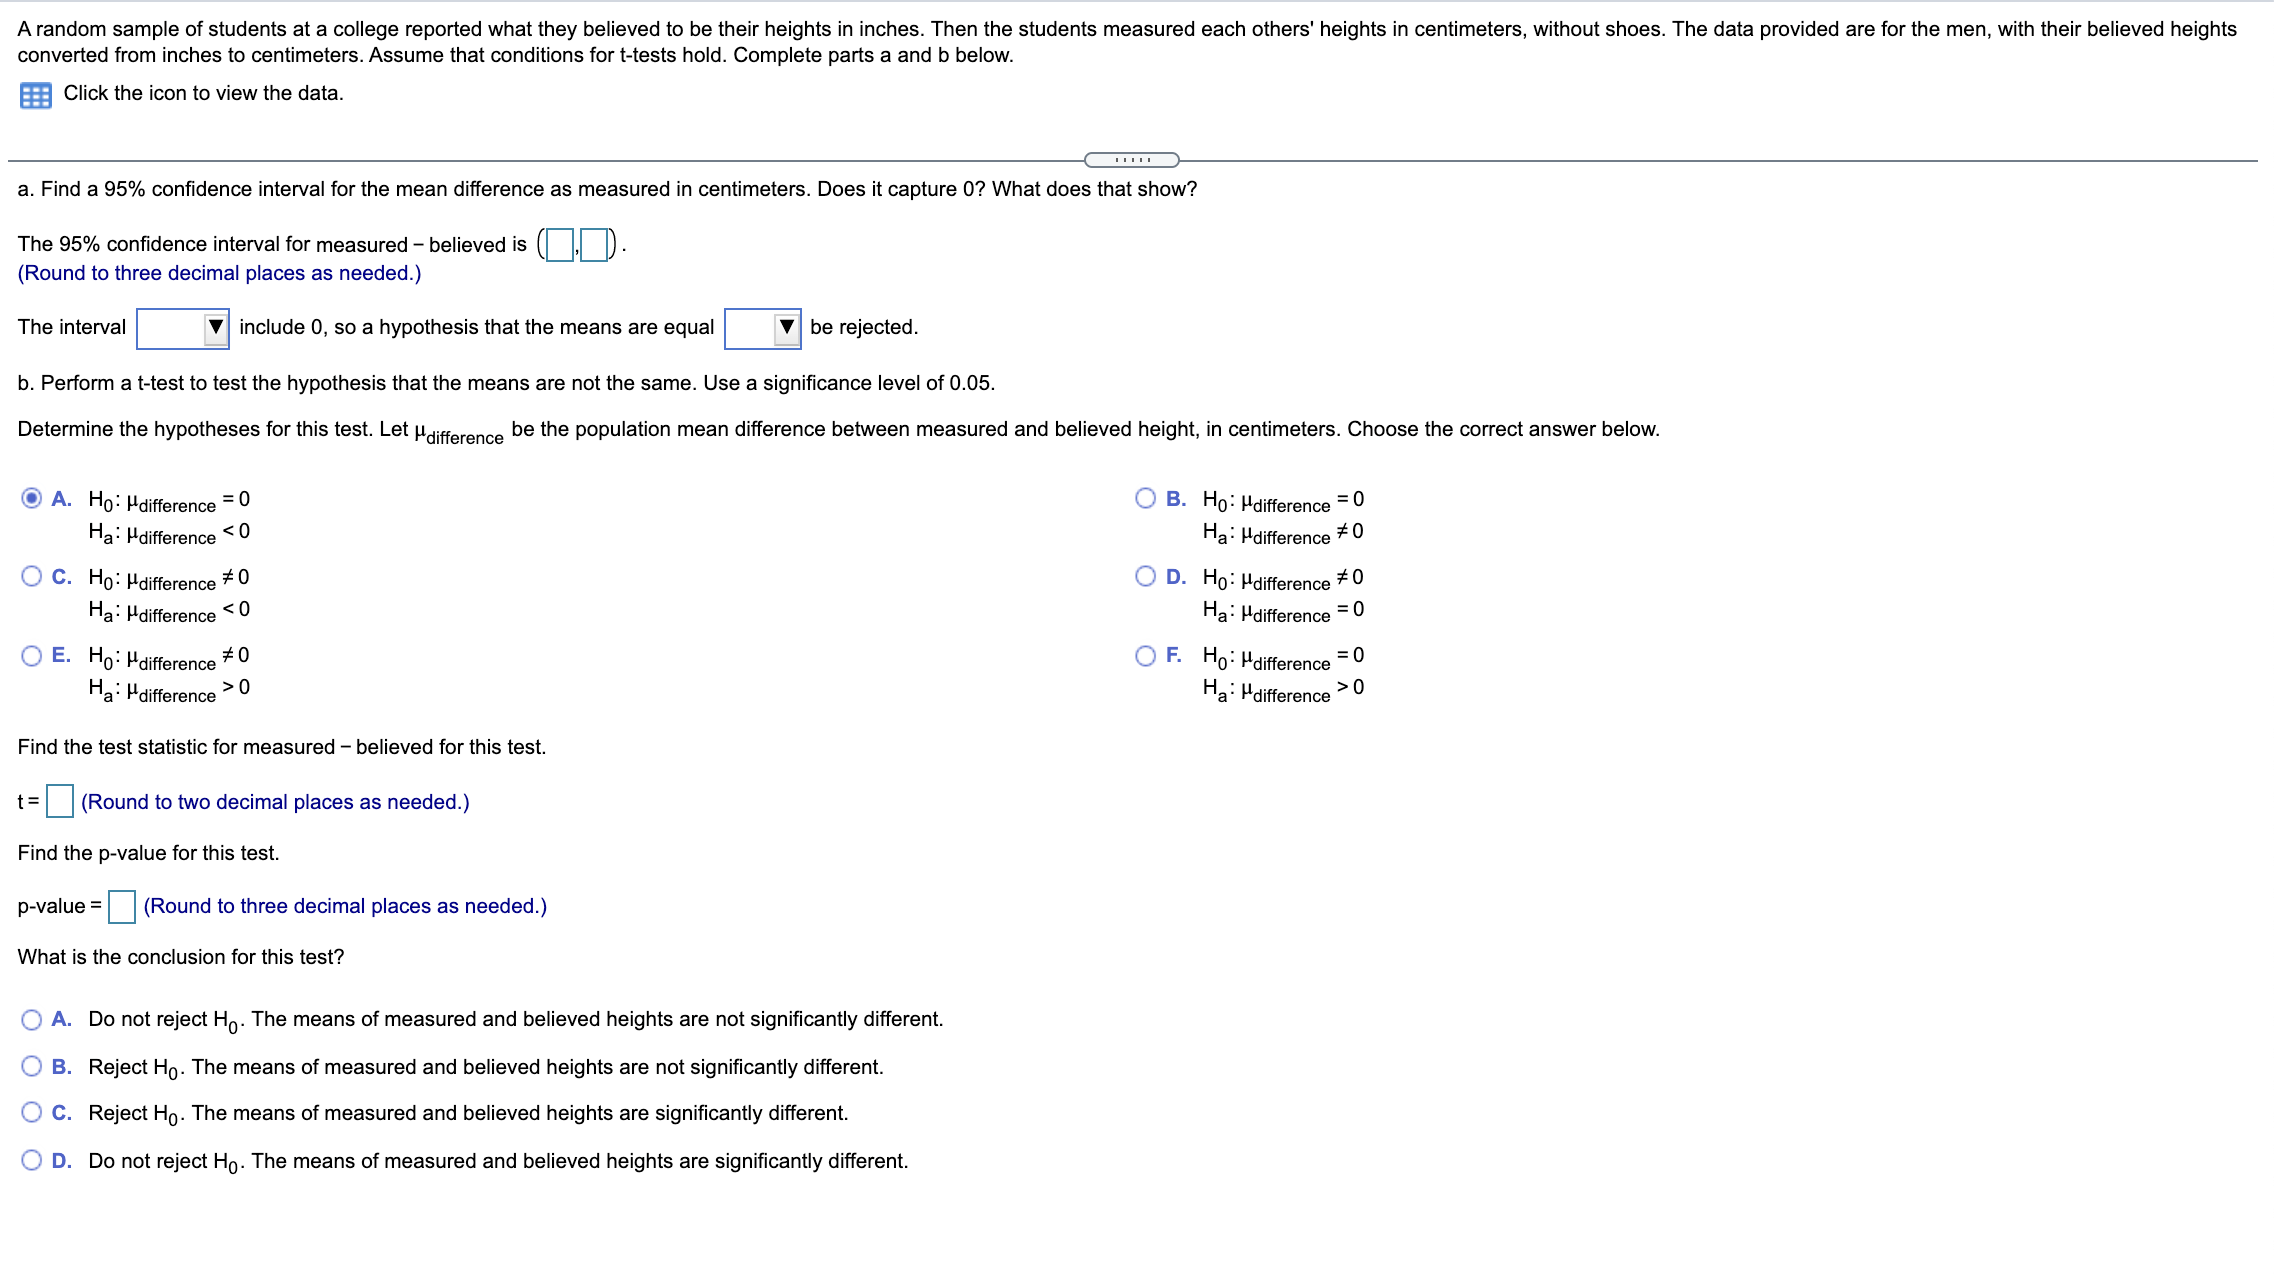
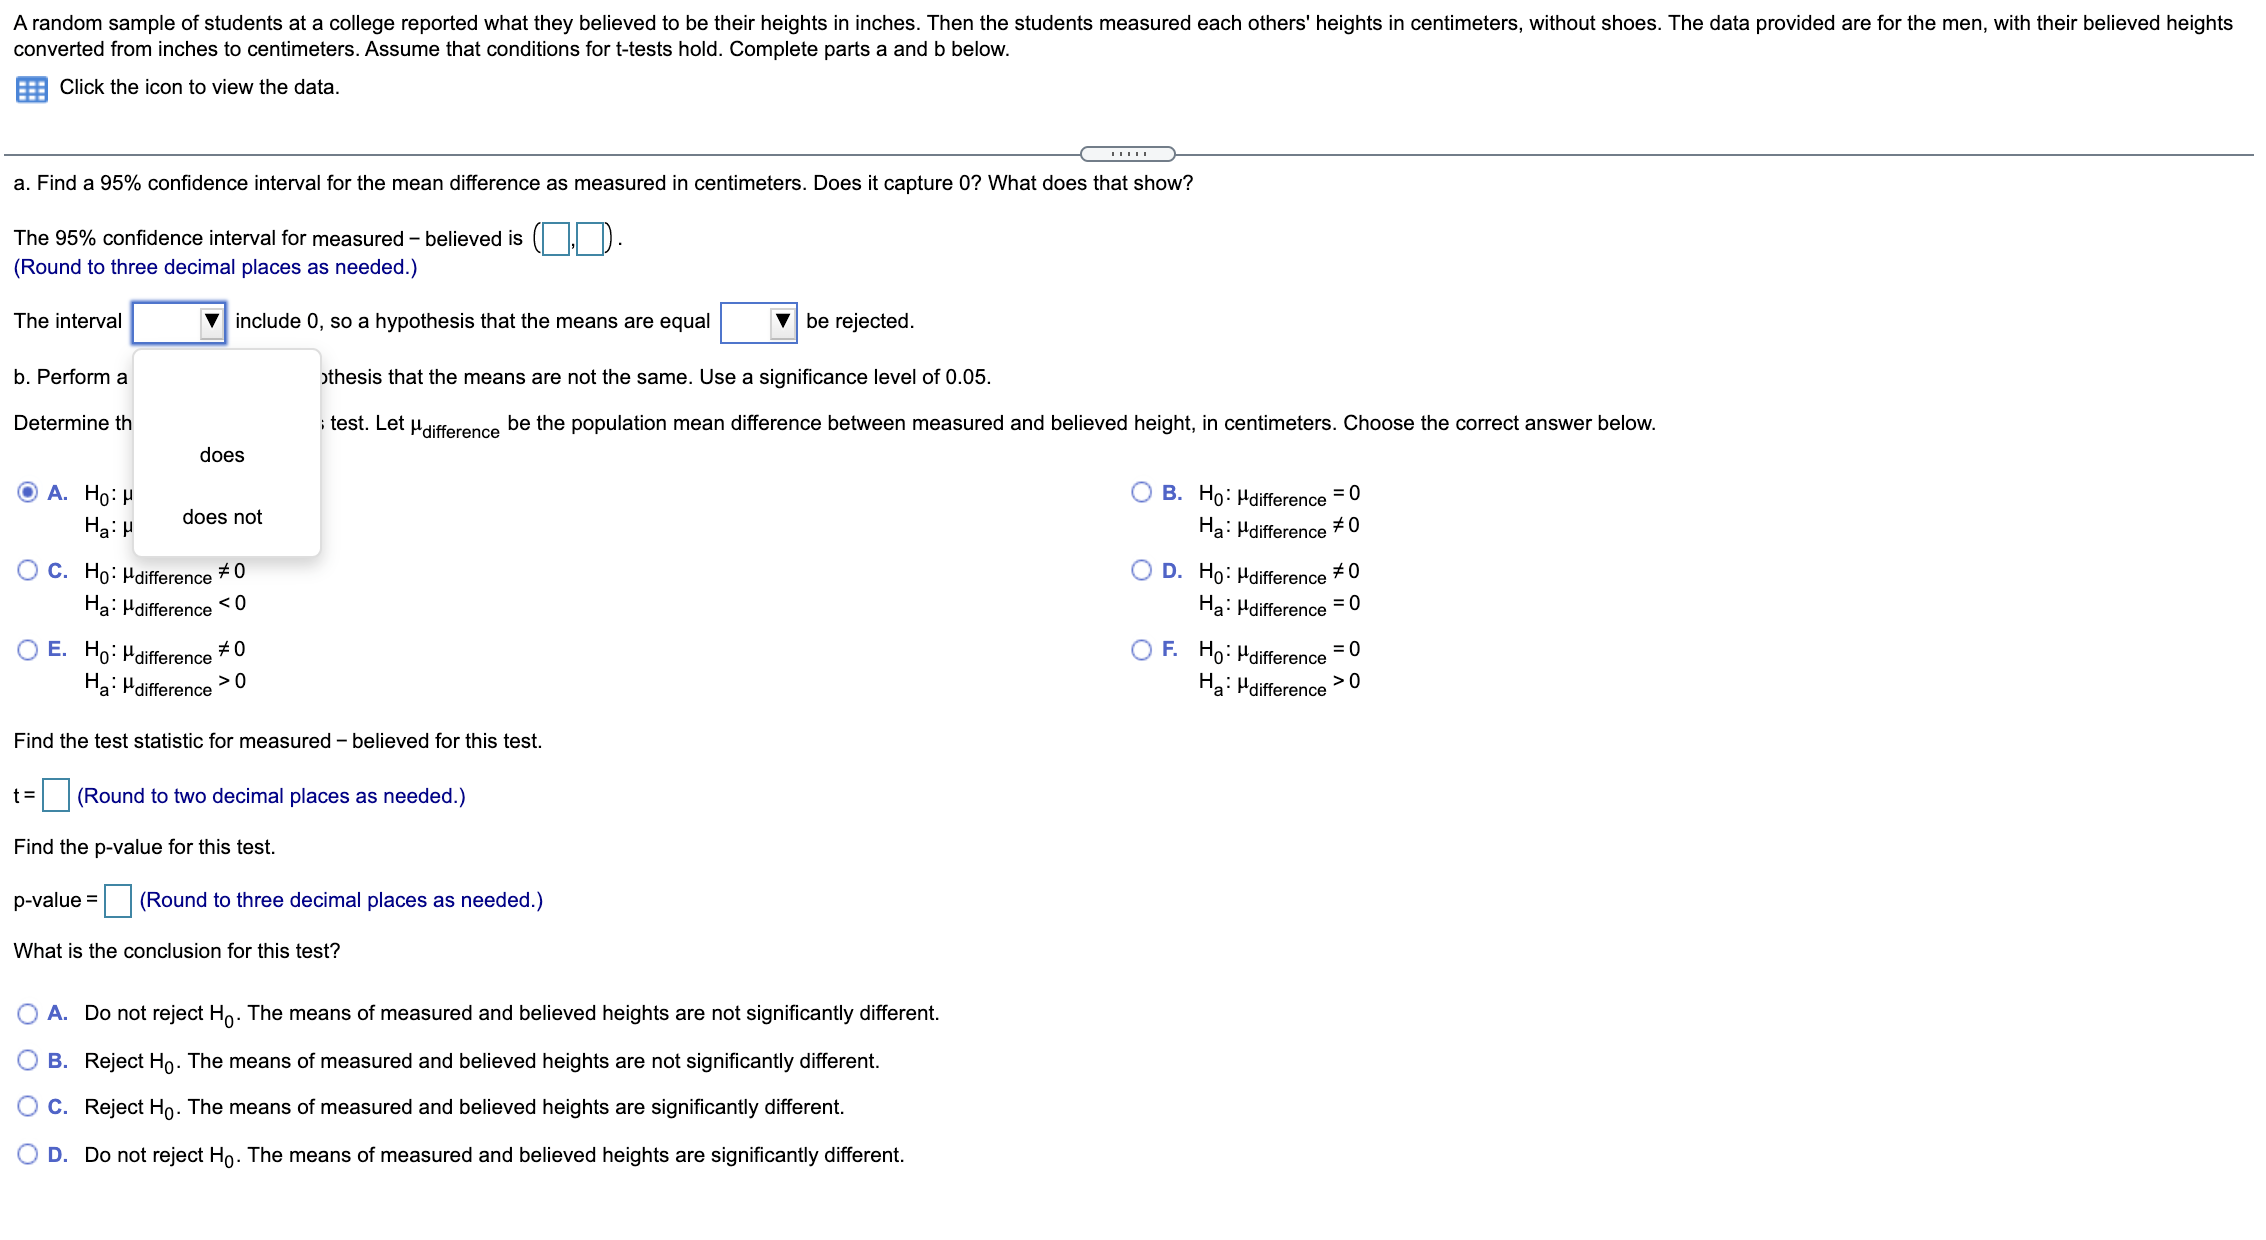
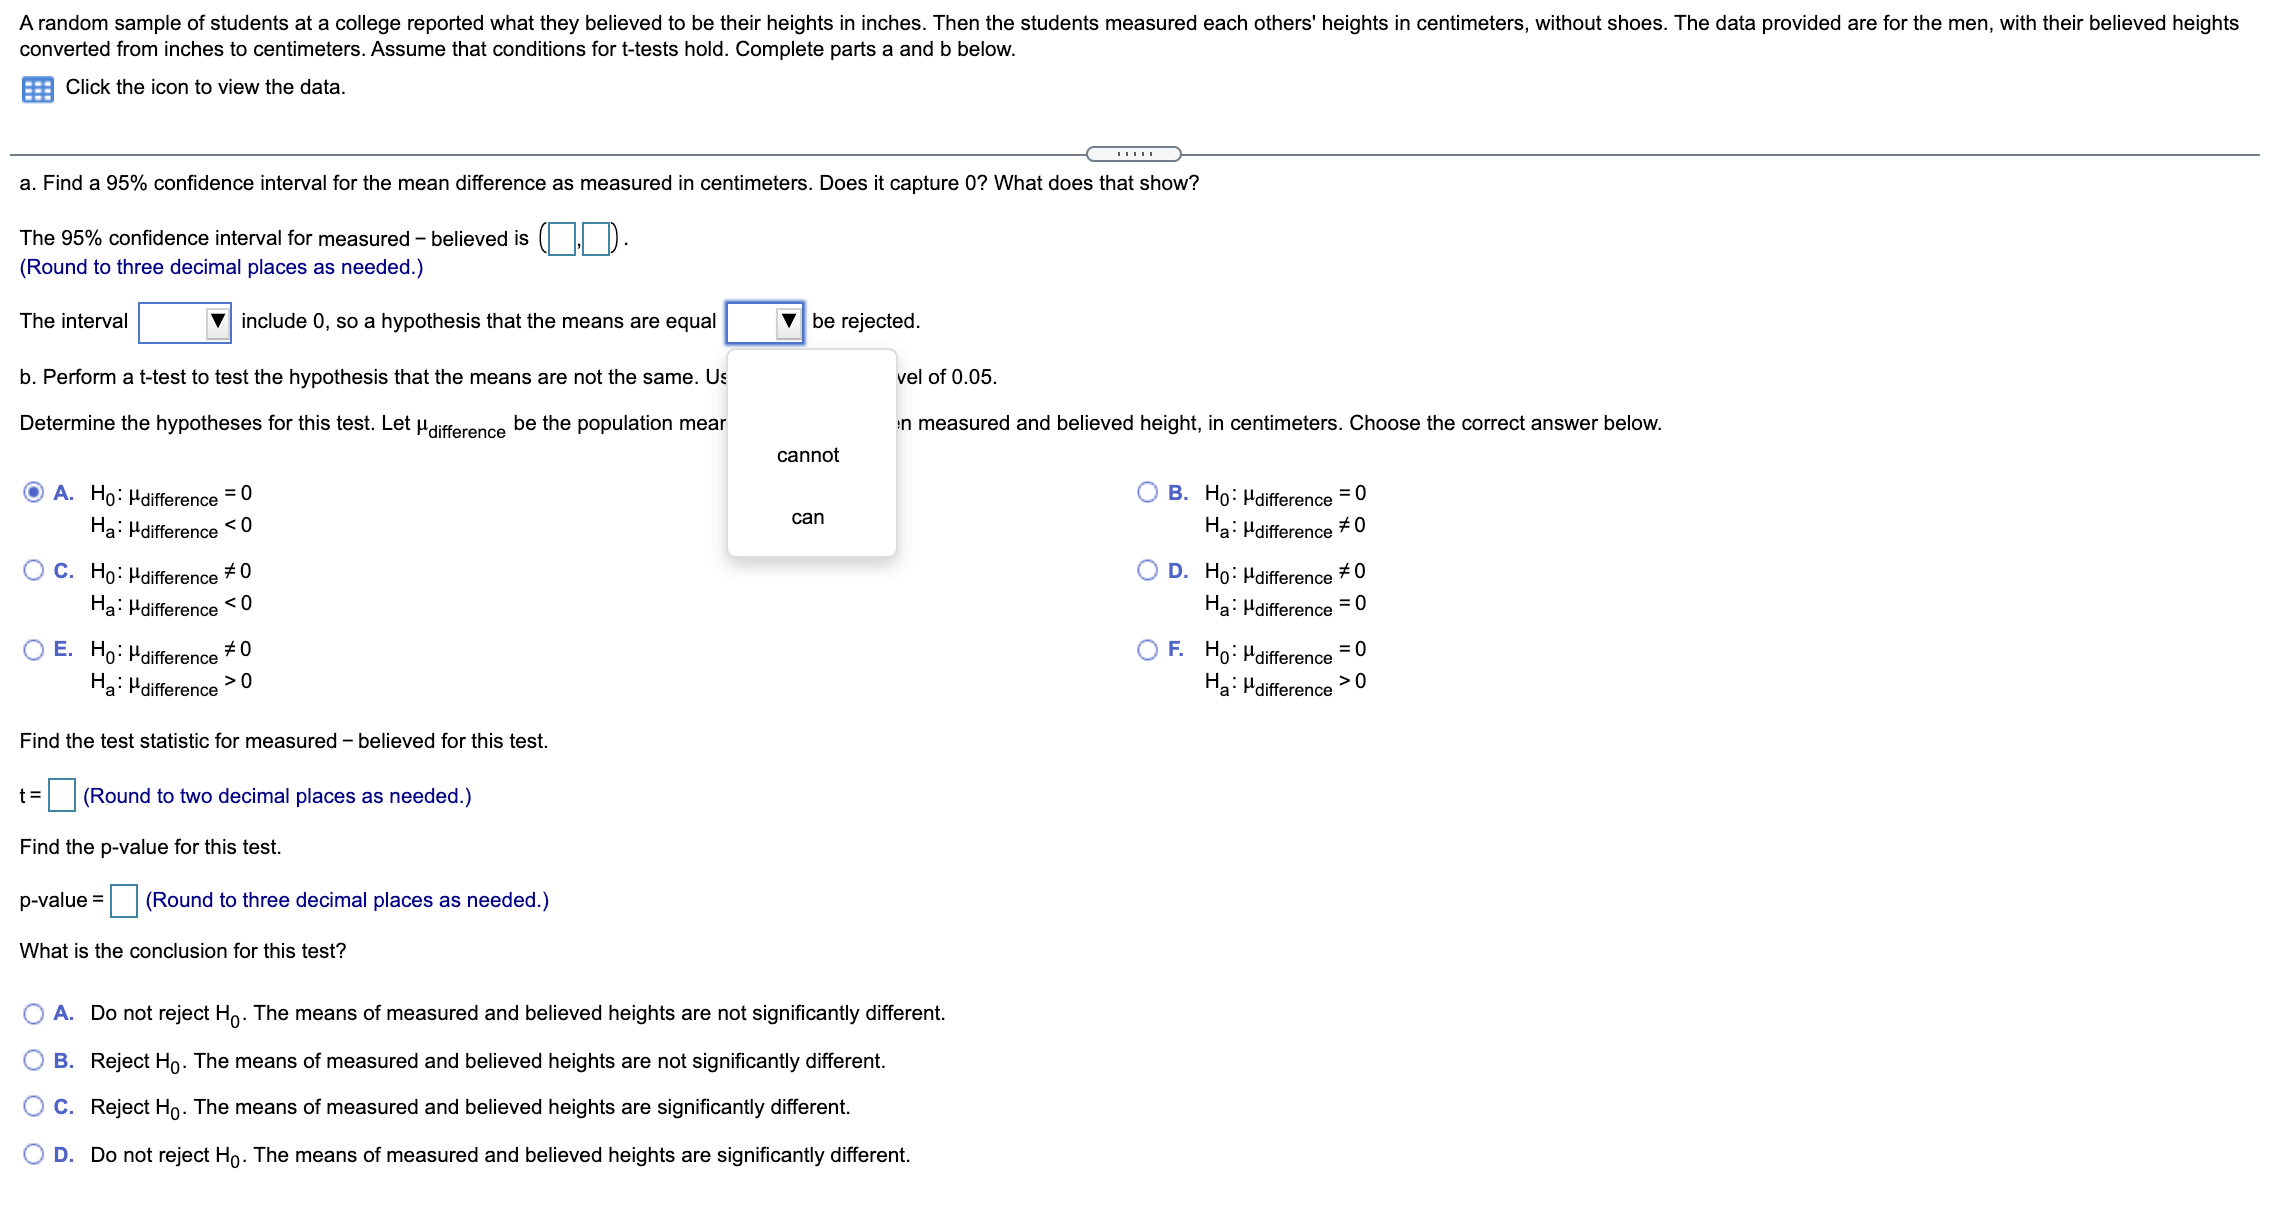
Data table Men Full Data Set Centimeters Centimeters Centimeters Centimeters (measured) (believed) (measured) (believed) 167 167.64 177 180.34 170 170.18 179 177.80 183 187.96 183 180.34 164 170.18 174 175.26 193 190.50 170 172.72 175 170.18 170 170.18 174 172.72 185 180.34 189 195.58A random sample of students at a college reported what they believed to be their heights in inches. Then the students measured each others' heights in centimeters, without shoes. The data provided are for the men, with their believed heights converted from inches to centimeters. Assume that conditions for t-tests hold. Complete parts a and b below. Click the icon to view the data. a. Find a 95% confidence interval for the mean difference as measured in centimeters. Does it capture 0? What does that show? The 95% confidence interval for measured - believed is (]]). (Round to three decimal places as needed.) The interval include 0, so a hypothesis that the means are equal be rejected. b. Perform a t-test to test the hypothesis that the means are not the same. Use a significance level of 0.05. Determine the hypotheses for this test. Let Hdifference be the population mean difference between measured and believed height, in centimeters. Choose the correct answer below. O A. Ho: Hdifference = 0 O B. Ho: Hdifference = 0 Ha : H difference 0 Ha: Hdifference > 0 Find the test statistic for measured - believed for this test. t=(Round to two decimal places as needed.) Find the p-value for this test. p-value = (Round to three decimal places as needed.) What is the conclusion for this test? O A. Do not reject Ho. The means of measured and believed heights are not significantly different. O B. Reject Ho. The means of measured and believed heights are not significantly different. O C. Reject Ho. The means of measured and believed heights are significantly different. O D. Do not reject Ho. The means of measured and believed heights are significantly different.A random sample of students at a college reported what they believed to be their heights in inches. Then the students measured each others' heights in centimeters, without shoes. The data provided are for the men, with their believed heights converted from inches to centimeters. Assume that conditions for t-tests hold. Complete parts a and b below. Click the icon to view the data. a. Find a 95% confidence interval for the mean difference as measured in centimeters. Does it capture 0? What does that show? The 95% confidence interval for measured - believed is (] ]). (Round to three decimal places as needed.) The interval include 0, so a hypothesis that the means are equal be rejected. b. Perform a thesis that the means are not the same. Use a significance level of 0.05. Determine th test. Let "difference be the population mean difference between measured and believed height, in centimeters. Choose the correct answer below. does O A. Ho: H O B. Ho: Hdifference = 0 Ha: H does not Ha: Hdifference # 0 O C. Ho: Hdifference # 0 O D. Ho: Hdifference # 0 Ha: Hdifference 0 Ha: Hdifference > 0 Find the test statistic for measured - believed for this test. t= (Round to two decimal places as needed.) Find the p-value for this test. p-value = (Round to three decimal places as needed.) What is the conclusion for this test? O A. Do not reject Ho. The means of measured and believed heights are not significantly different. O B. Reject Ho. The means of measured and believed heights are not significantly different. O C. Reject Ho. The means of measured and believed heights are significantly different. O D. Do not reject Ho. The means of measured and believed heights are significantly different.A random sample of students at a college reported what they believed to be their heights in inches. Then the students measured each others' heights in centimeters, without shoes. The data provided are for the men, with their believed heights converted from inches to centimeters. Assume that conditions for t-tests hold. Complete parts a and b below. Click the icon to view the data. a. Find a 95% confidence interval for the mean difference as measured in centimeters. Does it capture 0? What does that show? The 95% confidence interval for measured - believed is (]). (Round to three decimal places as needed.) The interval include 0, so a hypothesis that the means are equal be rejected. b. Perform a t-test to test the hypothesis that the means are not the same. Us vel of 0.05. Determine the hypotheses for this test. Let "difference be the population mear in measured and believed height, in centimeters. Choose the correct answer below. cannot O A. Ho: Hdifference = 0 O B. Ho: Hdifference = 0 Ha: Hdifference 0 Ha: Hdifference > 0 Find the test statistic for measured - believed for this test. t=(Round to two decimal places as needed.) Find the p-value for this test. p-value = (Round to three decimal places as needed.) What is the conclusion for this test? O A. Do not reject Ho. The means of measured and believed heights are not significantly different. O B. Reject Ho. The means of measured and believed heights are not significantly different. O C. Reject Ho. The means of measured and believed heights are significantly different. O D. Do not reject Ho. The means of measured and believed heights are significantly different
Step by Step Solution
There are 3 Steps involved in it

Get step-by-step solutions from verified subject matter experts