

Question: Data Table Men Pulse Before Pulse After 83 72 99 102 92 92 66 62 63 60 73 63 96 104 86 74 63 67In
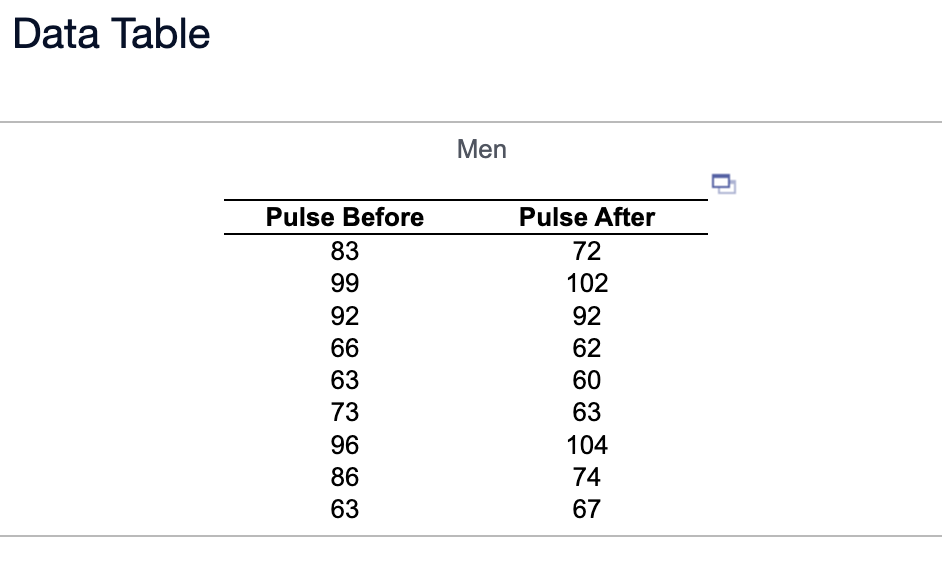
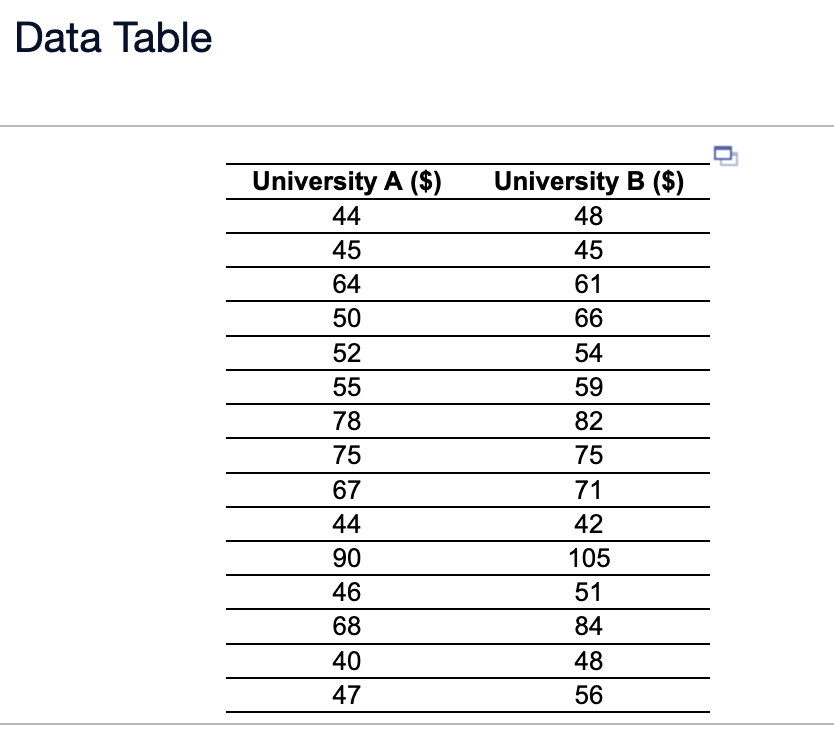
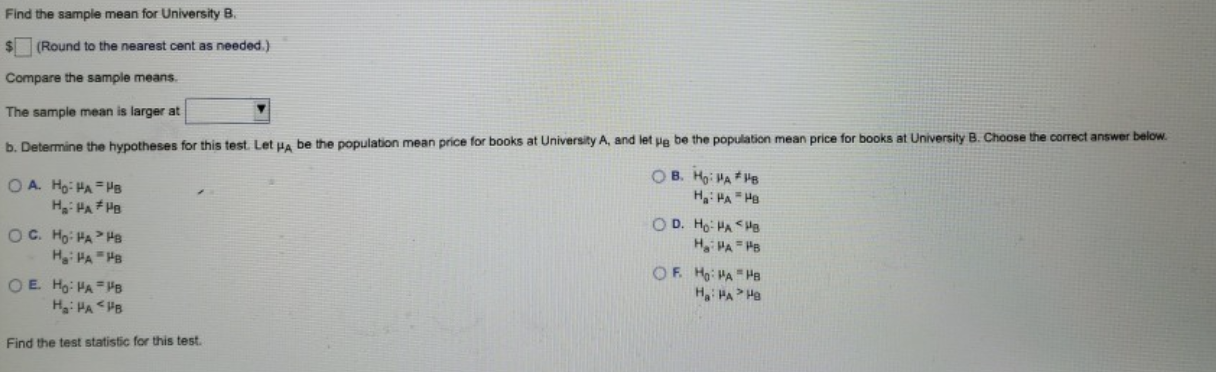
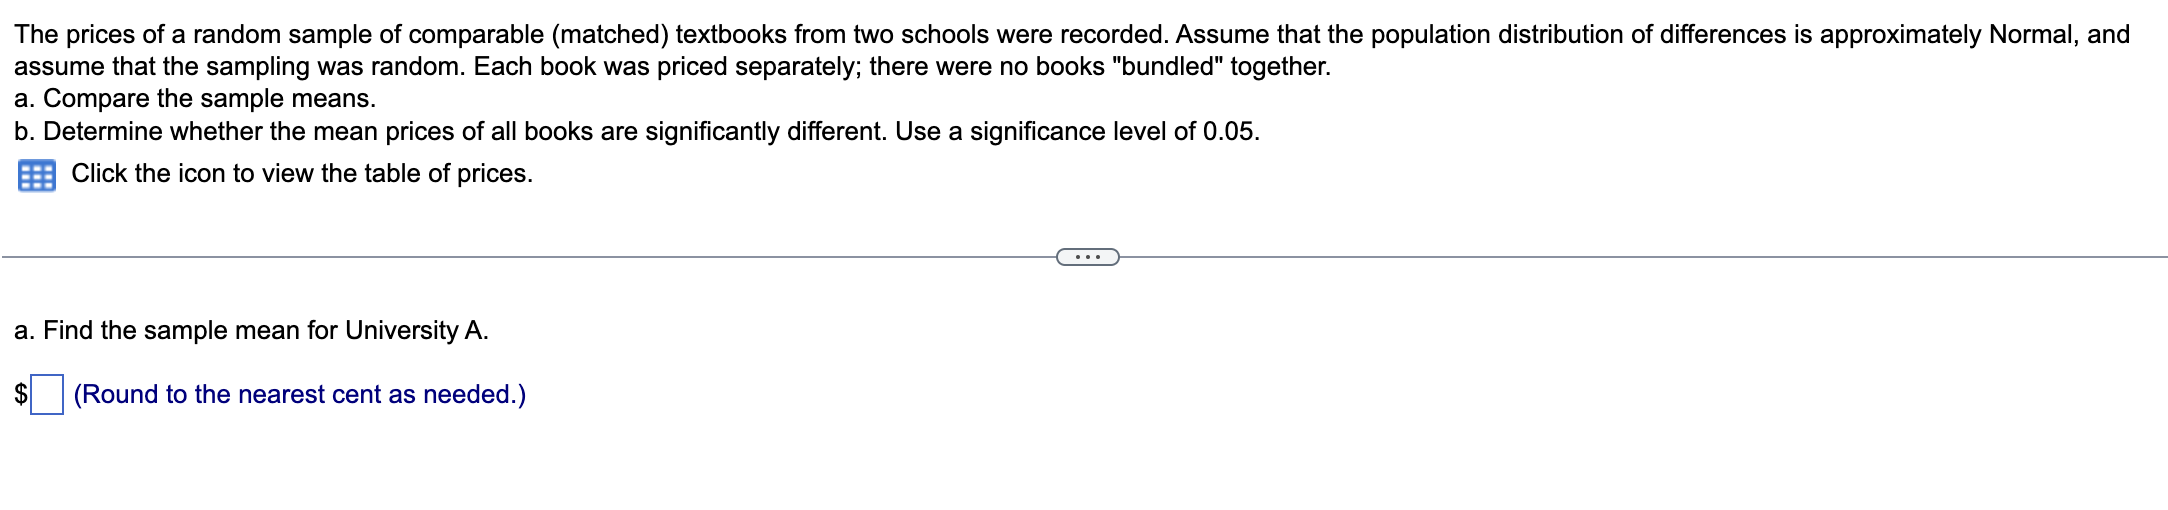
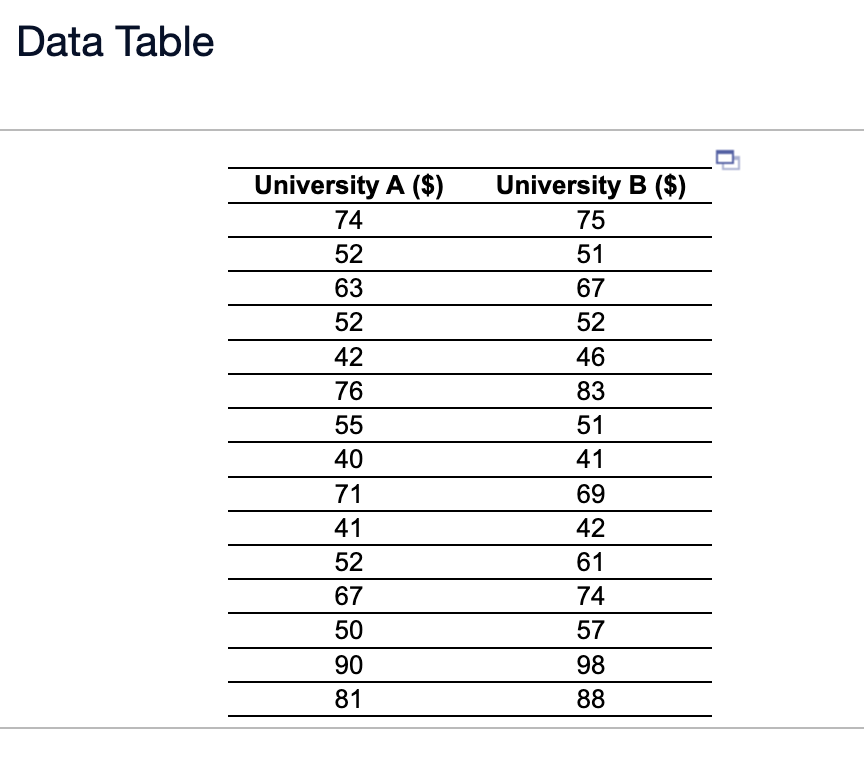
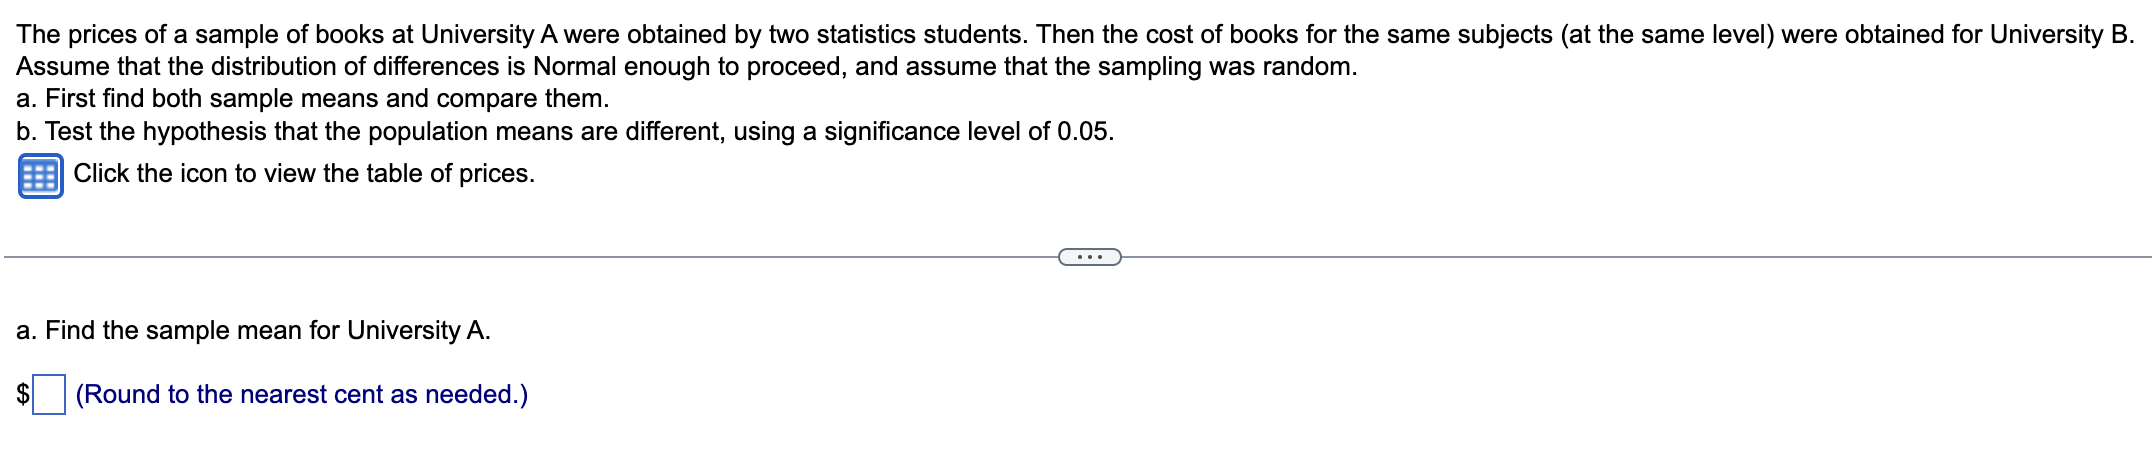
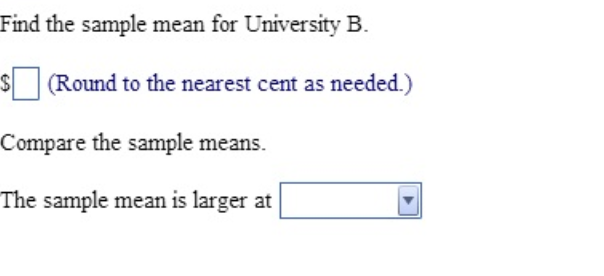
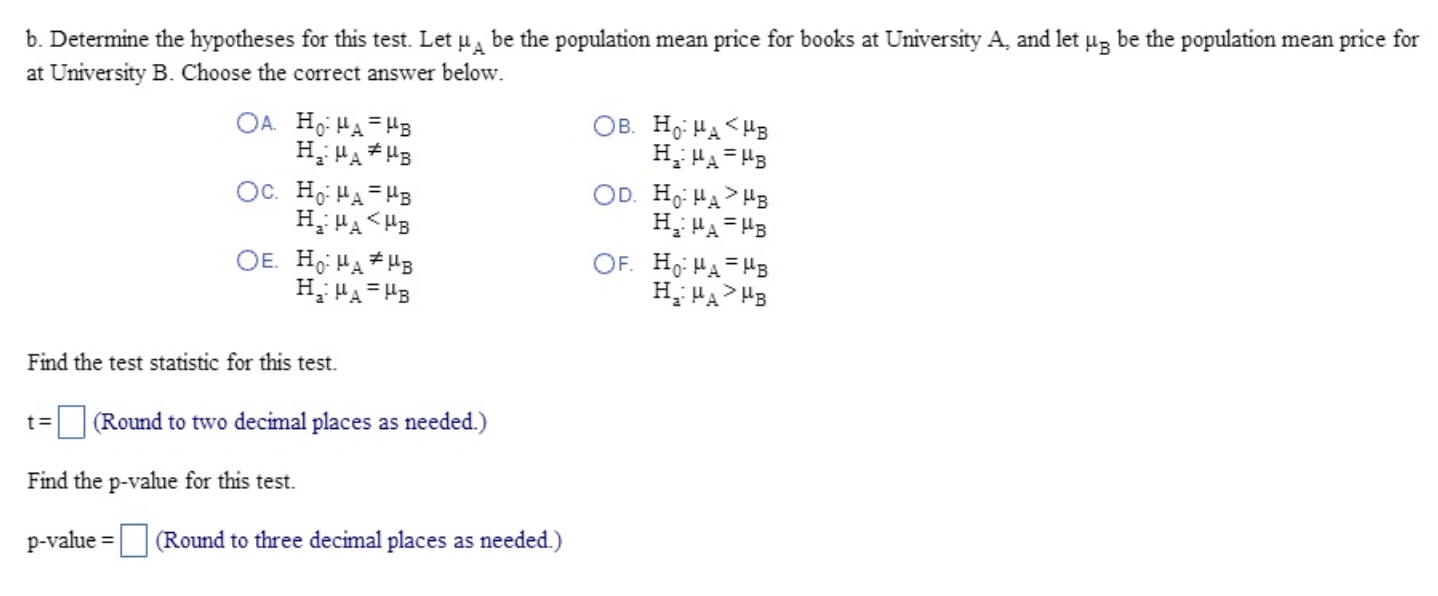
Data Table Men Pulse Before Pulse After 83 72 99 102 92 92 66 62 63 60 73 63 96 104 86 74 63 67In 3 statistics class, students took their pulses before and after being frightened. The frightening event was having the teacher scream and run from one side of the room to the other. The pulse rates (beats per minute) of the men before and after the scream were obtained separately and are shown in the accompanying table. Treat this as though it were a random sample of male community college students. Test the hypothesis that the mean of college men's pulse rates is higher after a fright, using a significance level of 0.05. Assume that all necessary conditions for carrying out a hypothesis test hold. Click the icon to view the table of pulse rates before and after the scream. E) Determine the hypotheses for this test. Use \"difference = \"before - \"after Choose the correct answer below. A' H03 \"difference = 0 {:2} 3- H0: \"difference > 0 Ha: \"difference # 0 Ha: \"difference = 0 C. H05 \"difference = 0 {I} D- H0: \"difference 0 Ha: \"difference = 0 E' H05 \"difference = 0 {I} F- H0: \"difference #0 HB Ha HA = HB Ha HA "HB OF HO MA = HB OE. HO: HA = HB Ha HA Ha Ha HA UB Find the test statistic for this test.The prices of a random sample of comparable (matched) textbooks from two schools were recorded. Assume that the population distribution of differences is approximately Normal, and assume that the sampling was random. Each book was priced separately; there were no books \"bundled\" together. a. Compare the sample means. b. Determine whether the mean prices of all books are significantly different. Use a significance level of 0.05. @ Click the icon to view the table of prices. a. Find the sample mean for University A. 35 (Round to the nearest cent as needed.) \fThe prices of a sample of books at UniversityAwere obtained by two statistics students. Then the cost of books for the same subjects (at the same level) were obtained for University B. Assume that the distribution of differences is Normal enough to proceed, and assume that the sampling was random. a. First find both sample means and compare them. b. Test the hypothesis that the population means are different, using a significance level of 0.05. Click the icon to view the table of prices. a. Find the sample mean for Universiw A. $D (Round to the nearest cent as needed.) Find the sample mean for University B. Round to the nearest cent as needed.) Compare the sample means. The sample mean is larger atb. Determine the hypotheses for this test. Let u be the population mean price for books at University A, and let up be the population mean price for at University B. Choose the correct answer below. OA. Ho. HA = HB OB. HOMA HB H.: HA # HB H.: HA = HB OC. Ho: HA = HB OD. Ho. HA > HB H: HA
Step by Step Solution
There are 3 Steps involved in it

Get step-by-step solutions from verified subject matter experts