

Question: Data table Muscateer Designs, Inc. Comparative Income Statement Years Ended December 31, 2024 and 2023 - 2024 2023 $ 428,950 $ 375,750 Net Sales
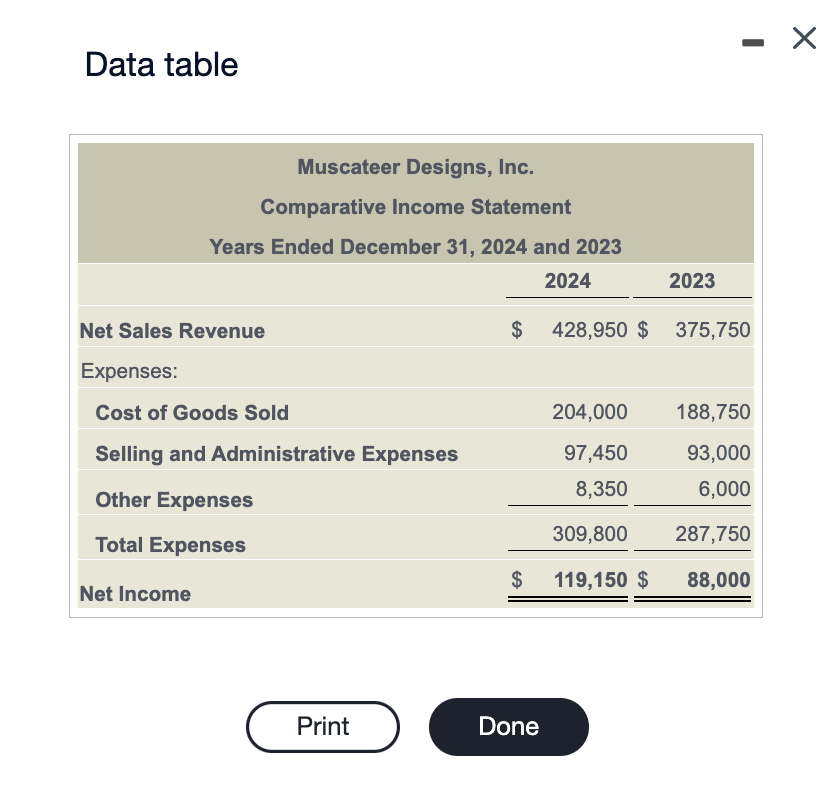
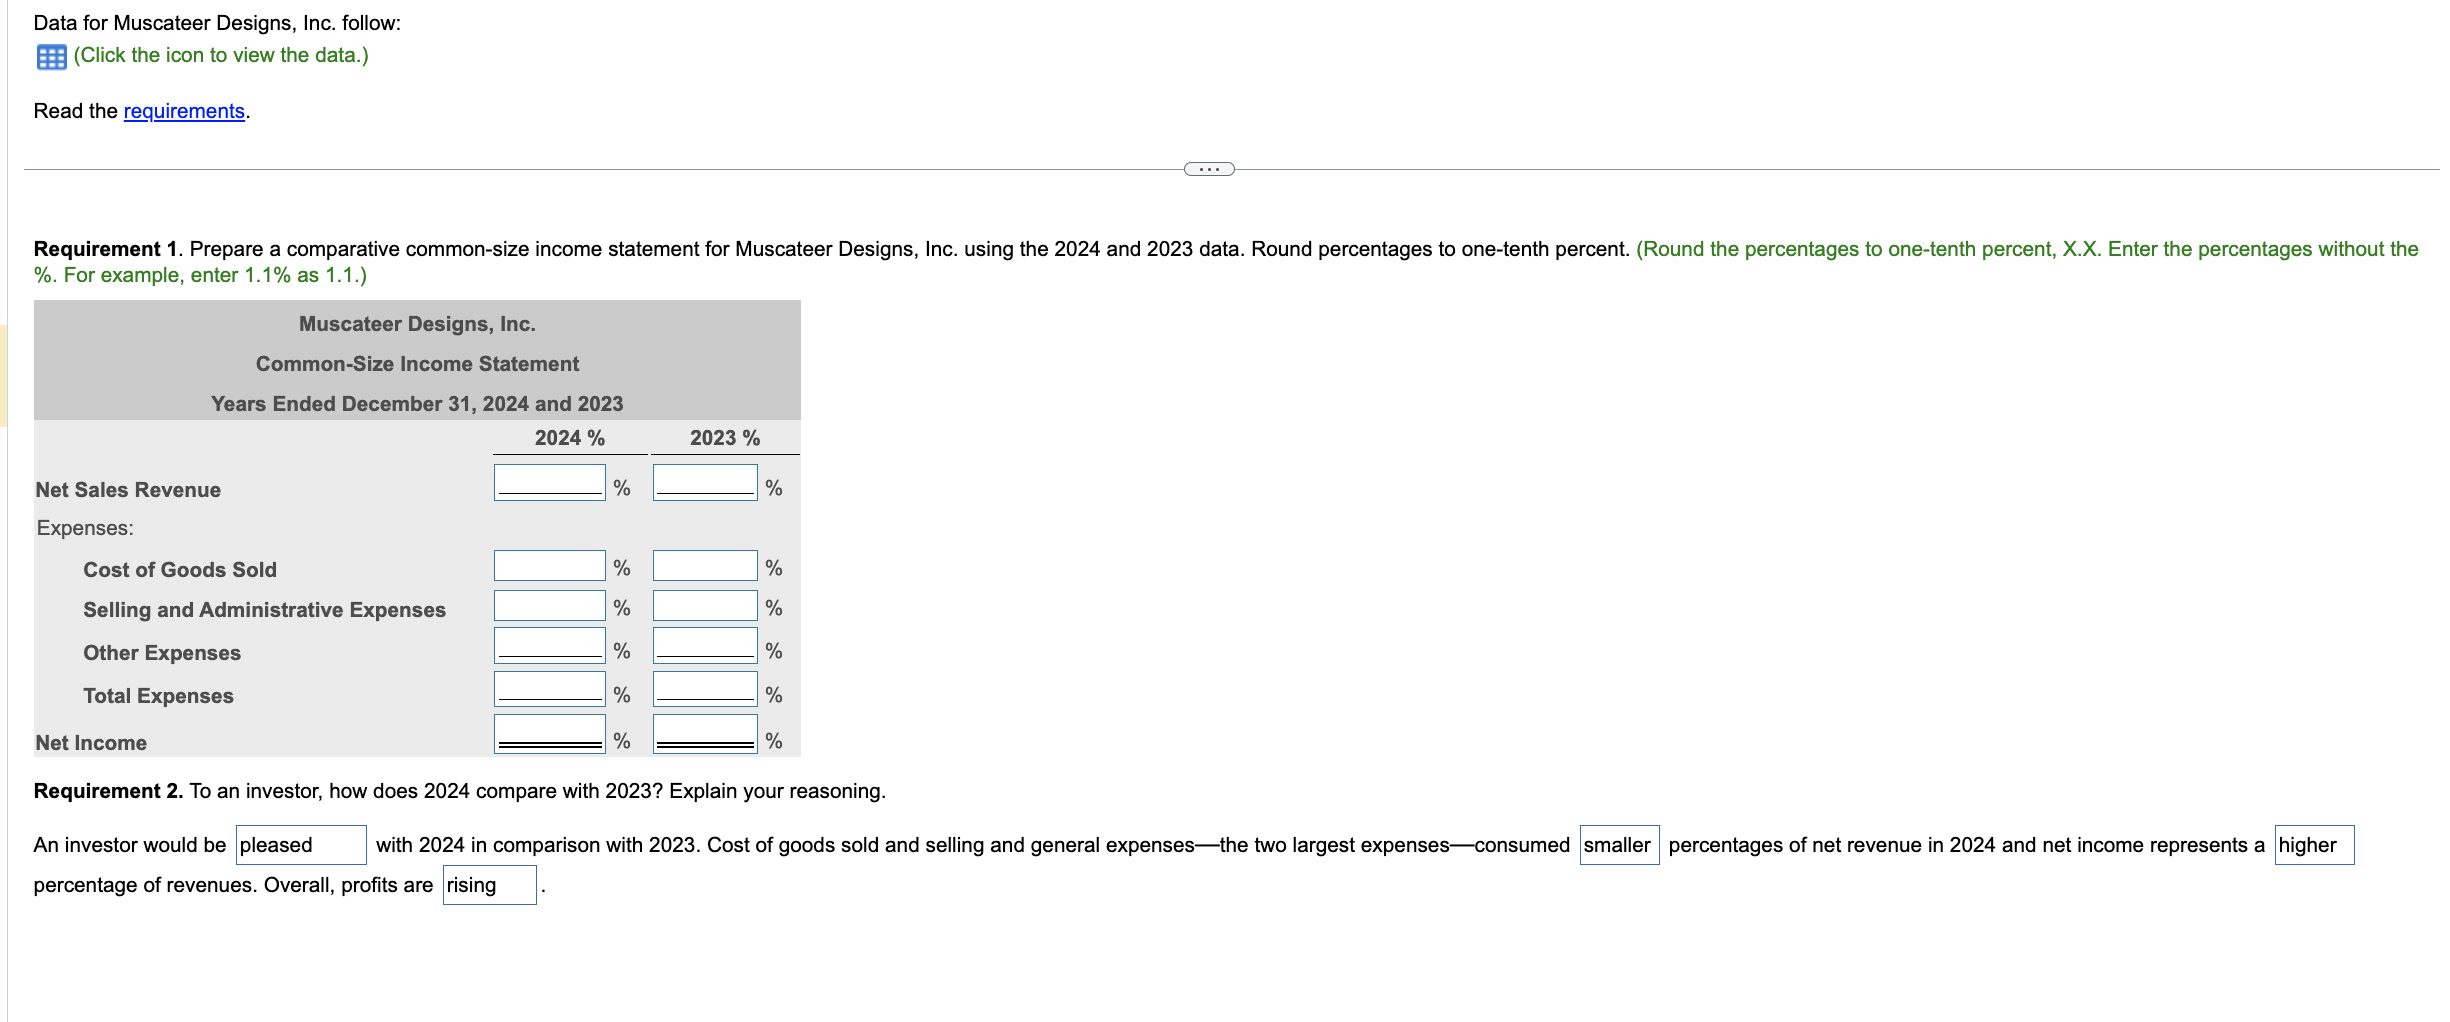
Data table Muscateer Designs, Inc. Comparative Income Statement Years Ended December 31, 2024 and 2023 - 2024 2023 $ 428,950 $ 375,750 Net Sales Revenue Expenses: Cost of Goods Sold 204,000 188,750 Selling and Administrative Expenses 97,450 93,000 8,350 6,000 Other Expenses 309,800 287,750 Total Expenses $ 119,150 $ 88,000 Net Income Print Done Data for Muscateer Designs, Inc. follow: (Click the icon to view the data.) Read the requirements. Requirement 1. Prepare a comparative common-size income statement for Muscateer Designs, Inc. using the 2024 and 2023 data. Round percentages to one-tenth percent. (Round the percentages to one-tenth percent, X.X. Enter the percentages without the %. For example, enter 1.1% as 1.1.) Muscateer Designs, Inc. Common-Size Income Statement Years Ended December 31, 2024 and 2023 2024 % 2023 % % % Net Sales Revenue Expenses: Cost of Goods Sold % % Selling and Administrative Expenses % % Other Expenses % % Total Expenses % % Net Income % % Requirement 2. To an investor, how does 2024 compare with 2023? Explain your reasoning. An investor would be pleased with 2024 in comparison with 2023. Cost of goods sold and selling and general expenses-the two largest expenses-consumed smaller percentages of net revenue in 2024 and net income represents a higher percentage of revenues. Overall, profits are rising
Step by Step Solution
There are 3 Steps involved in it

Get step-by-step solutions from verified subject matter experts