

Question: Data Table Muscateer Designs, Inc. Comparative Income Statement Years Ended December 31, 2018 and 2017 2018 2017 $ 430,000 $ 373,750 Net Sales Revenue Expenses:
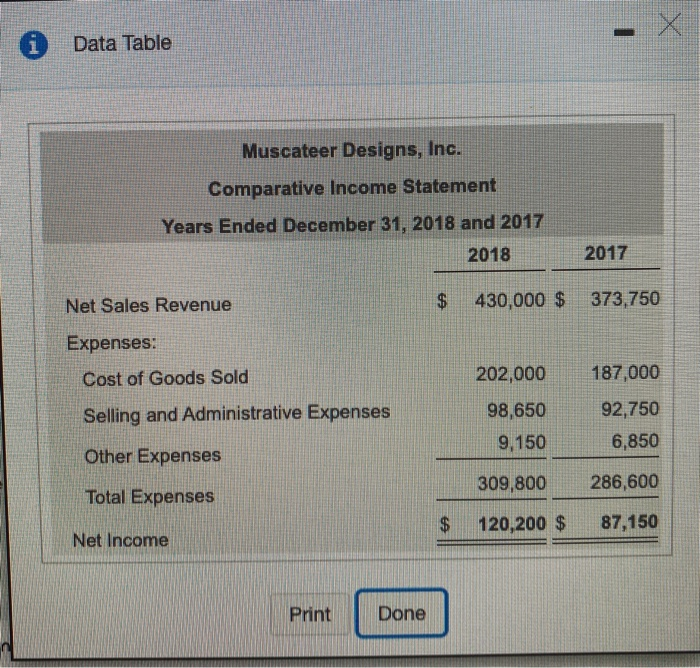
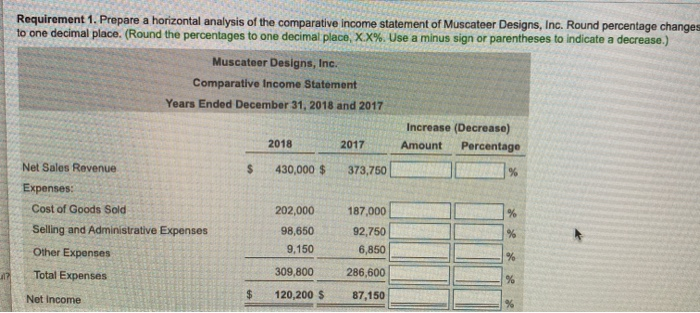

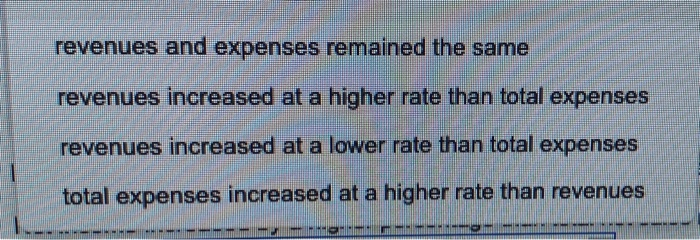
Data Table Muscateer Designs, Inc. Comparative Income Statement Years Ended December 31, 2018 and 2017 2018 2017 $ 430,000 $ 373,750 Net Sales Revenue Expenses: Cost of Goods Sold Selling and Administrative Expenses Other Expenses Total Expenses 202,000 98,650 9,150 187,000 92,750 6,850 309,800 286,600 $ 120,200 $ 87,150 Net Income Print Done Requirement 1. Prepare a horizontal analysis of the comparative income statement of Muscateer Designs, Inc. Round percentage changes to one decimal place. (Round the percentages to one decimal place, XX%. Use a minus sign or parentheses to indicate a decrease.) Muscateer Designs, Inc. Comparative Income Statement Years Ended December 31, 2018 and 2017 Increase (Decrease) Amount Percentage 2018 2017 430,000 $ 373,750 Net Sales Revenue Expenses: Cost of Goods Sold Selling and Administrative Expenses 202,000 98,650 9.150 Other Expenses Total Expenses 187,000 92,750 6,850 286,600 87,150 309,800 120,200 $ Net income Requirement 2. Why did 2018 net income increase by a higher percentage than net sales revenue? Net income increased by a higher percentage than total net sales revenue during 2018 because pe fildo and then continue to the next question. revenues and expenses remained the same revenues increased at a higher rate than total expenses revenues increased at a lower rate than total expenses total expenses increased at a higher rate than revenues
Step by Step Solution
There are 3 Steps involved in it

Get step-by-step solutions from verified subject matter experts