

Question: Data table Operating Operating Operating Income/ Revenues/ Income/ Total Total Assets Assets Requirements 1. Complete the table by filling in the blanks. 2. Use
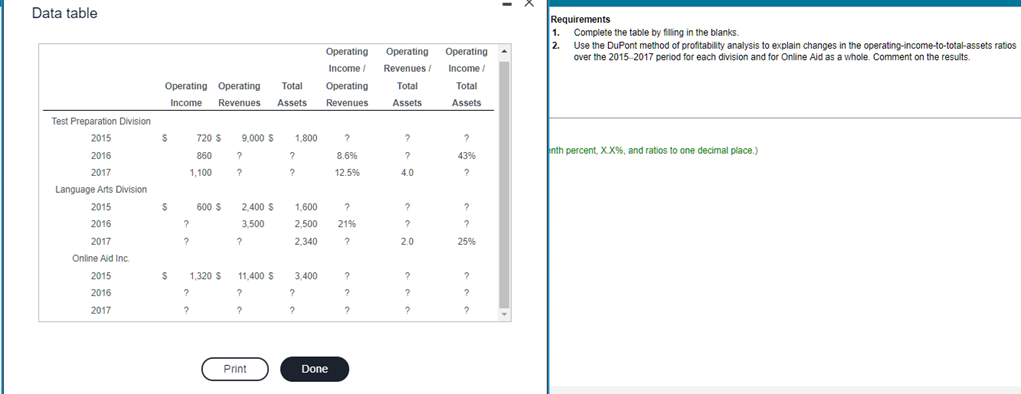
Data table Operating Operating Operating Income/ Revenues/ Income/ Total Total Assets Assets Requirements 1. Complete the table by filling in the blanks. 2. Use the DuPont method of profitability analysis to explain changes in the operating-income-to-total-assets ratios over the 2015-2017 period for each division and for Online Aid as a whole. Comment on the results. Income Revenues Operating Operating Total Assets Operating Revenues Test Preparation Division 2015 $ 720 $ 9,000 $ 1,800 ? ? ? 2016 nth percent, XX%, and ratios to one decimal place.) 860 ? ? 8.6% ? 43% 2017 1,100 ? ? 12.5% 4.0 ? Language Arts Division 2015 2016 2017 Online Aid Inc. 2015 2016 2017 $ 600 $ 2,400 $ 1,600 ? ? ? ? 3,500 2,500 21% ? ? ? ? 2,340 ? 2.0 25% $ 1,320 $ 11,400 $ 3,400 ? ? ? ? ? ? ? ? ? ? ? ? ? ? ? Print Done
Step by Step Solution
There are 3 Steps involved in it

Get step-by-step solutions from verified subject matter experts