

Question: Data table Requirements 1. Use the chart below to provide the owner with the cost information. Then use the completed chart to help you answer
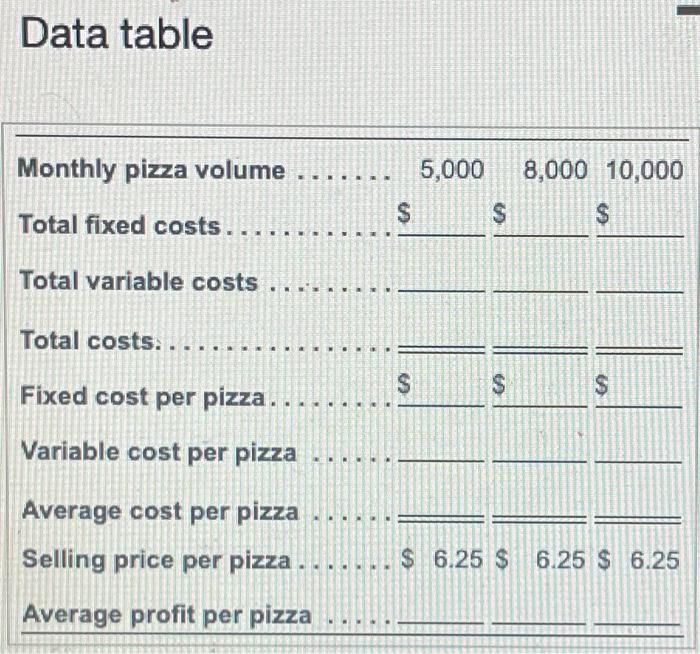
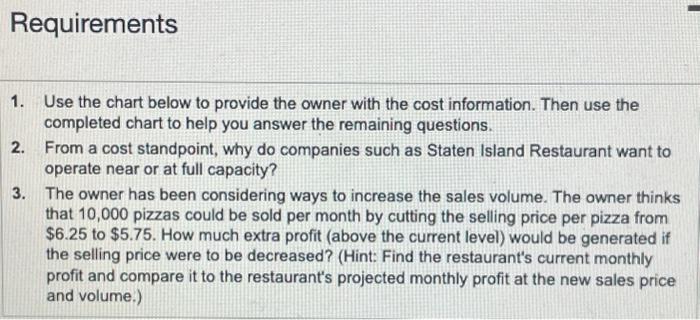

Data table Requirements 1. Use the chart below to provide the owner with the cost information. Then use the completed chart to help you answer the remaining questions. 2. From a cost standpoint, why do companies such as Staten Island Restaurant want to operate near or at full capacity? 3. The owner has been considering ways to increase the sales volume. The owner thinks that 10,000 pizzas could be sold per month by cutting the selling price per pizza from $6.25 to $5.75. How much extra profit (above the current level) would be generated if the selling price were to be decreased? (Hint: Find the restaurant's current monthly profit and compare it to the restaurant's projected monthly profit at the new sales price and volume.) The ownes of Staten island Restaurant is disappoimod because the restaurant has been averaging 8,000 pizza sales per month, but the restaurant and wat staff can make and serve 10,000 pimas per month. The vanable cost (for example, ingredionts) of each pioza is $1.45. Monthly foced costs (for example, deprociation, property taxes, buainess license, and manager's saiary) are $10,000 per month. The owner wants cost information about different volumes so that some operating decisions can be made. (Click the icon to view the chart for Requirement 1.) Road the Requirement 1. Use the chart bolow to provide the owner with the cost intormation. Then use the completed chart to help you answer the remaining questons. (Enter total variale costs to the nearest dolar. Emer costs per pizza, price per pizza, and profit per pizza to the nearest cent)
Step by Step Solution
There are 3 Steps involved in it

Get step-by-step solutions from verified subject matter experts