

Question: Data Table Trial V (ml) 110,1 In(103) 1/10,1 V (ml) (with H/starch) SO,- H:0 Time for reaction (5) , HO A 5.0 45.0 10.0 40.0
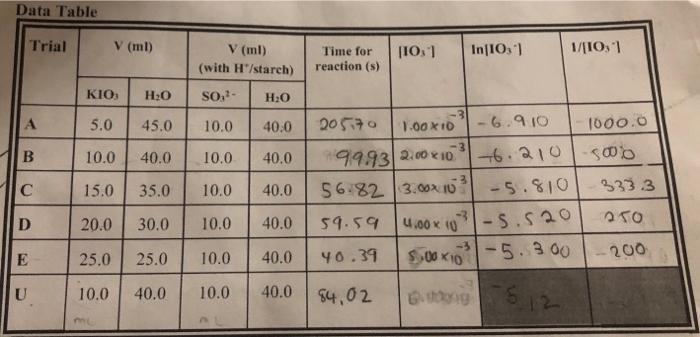
Data Table Trial V (ml) 110,1 In(103) 1/10,1 V (ml) (with H/starch) SO,- H:0 Time for reaction (5) , HO A 5.0 45.0 10.0 40.0 B 10.0 40.0 10.0 40.0 15.0 35.0 10.0 40.0 D 20.0 30.0 10.0 40.0 20570 1.00*10 -6.910 1000.0 3 99.932.00210 -6.210-500 56.82 3.00x10³ 5.810 3333 59.59 -5.520 40.39 5.00 10'-5. 300 - 5.300-200 84,02 05.12 4.00 x 10 E 25.0 25.0 10.0 40.0 U 10.0 40.0 10.0 40.0 1) Use Excel to prepare the three plots: "quantity" vs. time, and circle the correct order reaction. Ensure that graphs are labeled properly and that you indicate the correlation factor for linearity on each graph. Zero-order reaction equation and R2 value from the plot: First-order reaction equation and R value from the plot: Second-order reaction equation and R value from the plot
Step by Step Solution
There are 3 Steps involved in it

Get step-by-step solutions from verified subject matter experts