

Question: Data Table - X Verifine Department Stores, Inc. Balance Sheet Compared with Industry Average Verifine Department Stores, Inc. Income Statement Compared with Industry Average
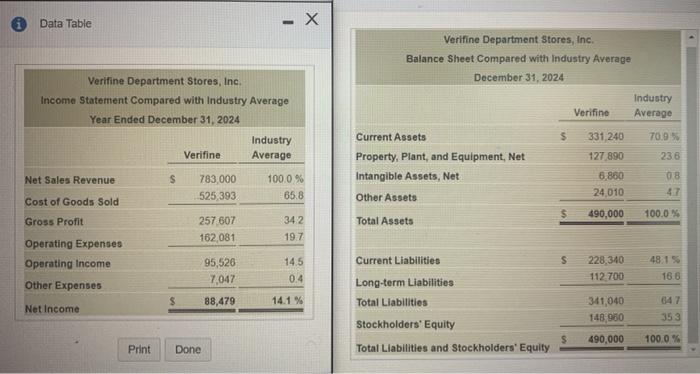
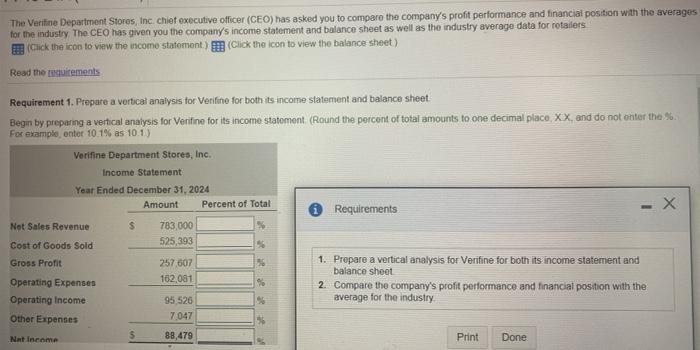
Data Table - X Verifine Department Stores, Inc. Balance Sheet Compared with Industry Average Verifine Department Stores, Inc. Income Statement Compared with Industry Average Year Ended December 31, 2024 December 31, 2024 Industry Verifine Average Industry Current Assets $ 331,240 70.9% Verifine Average Property, Plant, and Equipment, Net 127,890 23.6 Net Sales Revenue S 783,000 100.0% Intangible Assets, Net 6,860 08 525,393 65.8 24,010 47 Other Assets Cost of Goods Sold $ 490,000 100.0% Gross Profit 257,607 34.2 Total Assets 162,081 19.7 Operating Expenses Operating Income 95,526 14.5 Current Liabilities S 228,340 48.1% Other Expenses 7,047 0.4 112,700 16.6 Long-term Liabilities: $ 88,479 14.1% Total Liabilities 341,040 64.7 Net Income 148,960 353 Stockholders' Equity 490,000 100.0% Print Done Total Liabilities and Stockholders' Equity
Step by Step Solution
There are 3 Steps involved in it

Get step-by-step solutions from verified subject matter experts