

Question: Data Tables - Example Hello Company makes three different products. Due to the constraints of their manufacturing equipment and warehouse facility, the company is only
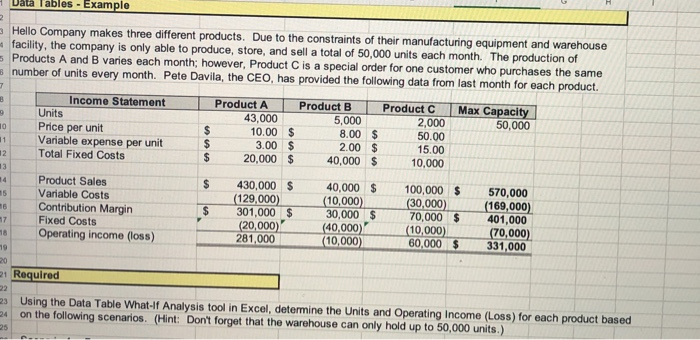
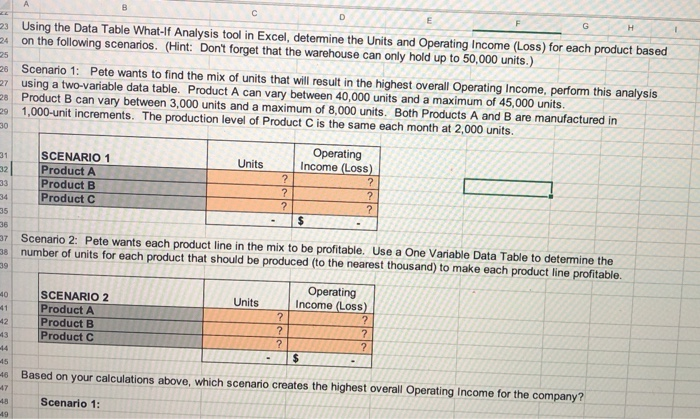
Data Tables - Example Hello Company makes three different products. Due to the constraints of their manufacturing equipment and warehouse facility, the company is only able to produce, store, and sell a total of 50,000 units each month. The production of Products A and B varies each month; however, Product C is a special order for one customer who purchases the same 3 number of units every month. Pete Davila, the CEO, has provided the following data from last month for each product. Income Statement Product A Product B Product C Max Capacity 43,000 5,000 2,000 50,000 Price per unit $ 10.00 $ 8.00 $ 50.00 11 Variable expense per unit $ 3.00 $ 2.00 $ 15.00 Total Fixed Costs $ 20,000 $ 40,000 $ 10,000 3 Units 10 12 13 14 15 $ Product Sales Variable Costs Contribution Margin Fixed Costs Operating income (loss) $ 430,000 $ (129,000) 301,000 $ (20,000) 281,000 17 18 40,000 $ (10,000) 30,000 $ (40,000) (10,000) 100,000 $ (30,000) 70,000 $ (10,000) 60,000 $ 570,000 (169,000) 401,000 (70,000) 331,000 19 20 21 Required 23 Using the Data Table What If Analysis tool in Excel, determine the Units and Operating Income (Loss) for each product based 24 on the following scenarios. (Hint: Don't forget that the warehouse can only hold up to 50,000 units.) 25 G H 25 - Using the Data Table What-lf Analysis tool in Excel, determine the Units and Operating Income (Loss) for each product based 24 on the following scenarios. (Hint: Don't forget that the warehouse can only hold up to 50,000 units.) 26 Scenario 1: Pete wants to find the mix of units that will result in the highest overall Operating Income, perform this analysis 27 using a two-variable data table. Product A can vary between 40,000 units and a maximum of 45,000 units. Product B can vary between 3,000 units and a maximum of 8,000 units. Both Products A and B are manufactured in - 1,000-unit increments. The production level of Product C is the same each month at 2,000 units. 28 30 Operating 31 SCENARIO 1 Units Income (Loss) 32 Product A ? ? 33 Product B ? ? 34 Product C ? ? 35 $ 36 - Scenario 2: Pete wants each product line in the mix to be profitable. Use a One Variable Data Table to determine the 38 number of units for each product that should be produced to the nearest thousand) to make each product line profitable. Operating 40 SCENARIO 2 Units Income (Loss) Product A ? ? 42 Product B ? ? 13 Product C ? $ 45 39 ? 446 Based on your calculations above, which scenario creates the highest overall Operating Income for the company? -18 -19 Scenario 1
Step by Step Solution
There are 3 Steps involved in it

Get step-by-step solutions from verified subject matter experts