

Question: Data: This assignment makes use of annual data for two risky asset classes. The stock index proxies for equities while the bond index proxies for
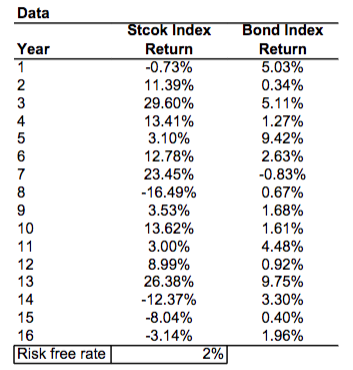
Data: This assignment makes use of annual data for two risky asset classes. The stock index proxies for equities while the bond index proxies for bonds. Annual return values for each of these securities during a 16-year period are provided in a spreadsheet named HW2 data.xlsx (hypothetical values). You also need an estimate of the risk-free rate (rf). For this case we assume rf = 2%
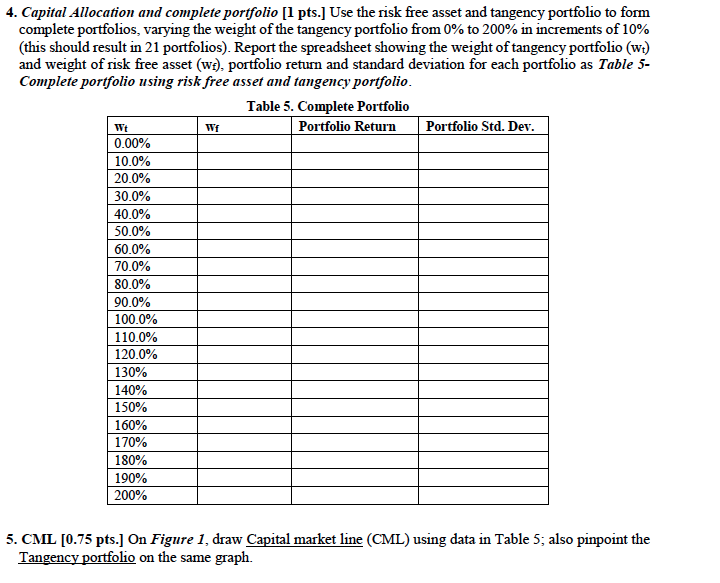
4. Capital Allocation and complete portfolio [1 pts.] Use the risk free asset and tangency portfolio to form complete portfolios, varying the weight of the tangency portfolio from 0% to 200% in increments of 10% (this should result in 21 portfolios). Report the spreadsheet showing the weight of tangency portfolio (wt) and weight of risk free asset (wi), portfolio return and standard deviation for each portfolio as Table 5- Complete portfolio using risk free asset and tangency portfolio Table 5. Complete Portfolio Portfolio Return Portfolio Std. De Wt 0.00% 10.0% 20.0% 30.0% 40.0% 50.0% 60.0% 70.0% 80.0% 90.0% 100.0% 110.0% 120.0% 130% 140% 50% 160% 170% 180% 190% 200% Wf 5. CML 0.75 pts.1 On Figure 1, draw Capital market line (CML) using data in Table 5 also pinpoint the Tangency portfolio on the same graph. 4. Capital Allocation and complete portfolio [1 pts.] Use the risk free asset and tangency portfolio to form complete portfolios, varying the weight of the tangency portfolio from 0% to 200% in increments of 10% (this should result in 21 portfolios). Report the spreadsheet showing the weight of tangency portfolio (wt) and weight of risk free asset (wi), portfolio return and standard deviation for each portfolio as Table 5- Complete portfolio using risk free asset and tangency portfolio Table 5. Complete Portfolio Portfolio Return Portfolio Std. De Wt 0.00% 10.0% 20.0% 30.0% 40.0% 50.0% 60.0% 70.0% 80.0% 90.0% 100.0% 110.0% 120.0% 130% 140% 50% 160% 170% 180% 190% 200% Wf 5. CML 0.75 pts.1 On Figure 1, draw Capital market line (CML) using data in Table 5 also pinpoint the Tangency portfolio on the same graph
Step by Step Solution
There are 3 Steps involved in it

Get step-by-step solutions from verified subject matter experts