

Question: Data: Time Consistency 0 0.0299 5 0.03 10 0.03 15 0.03 20 0.03 25 0.03 30 0.03 35 0.0301 40 0.03 45 0.0299 50 0.0299
 Data:
Data:
Time Consistency 0 0.0299 5 0.03 10 0.03 15 0.03 20 0.03 25 0.03 30 0.03 35 0.0301 40 0.03 45 0.0299 50 0.0299 55 0.0301 60 0.0299 65 0.03 70 0.0299 75 0.03 80 0.0297 85 0.0298 90 0.0297 95 0.0299 100 0.0297 105 0.0297 110 0.0295 115 0.0295 120 0.0294 125 0.0295 130 0.0293 135 0.0294 140 0.0292 145 0.0292 150 0.0292 155 0.0291 160 0.0292 165 0.0291 170 0.0291 175 0.029 180 0.0291 185 0.029 190 0.0289 195 0.0289 200 0.0289 205 0.0288 210 0.0289 215 0.0288 220 0.0288 225 0.0288 230 0.0288 235 0.0287 240 0.0288 245 0.0288 250 0.0287 255 0.0287 260 0.0287 265 0.0288 270 0.0287 275 0.0286 280 0.0288 285 0.0287 290 0.0286 295 0.0286 300 0.0286 305 0.0286 310 0.0288 315 0.0287 320 0.0286 325 0.0285 330 0.0286 335 0.0286 340 0.0286 345 0.0285 350 0.0285 355 0.0285 360 0.0286 365 0.0286 370 0.0286 375 0.0286 380 0.0286 385 0.0285 390 0.0286 395 0.0285 400 0.0286 405 0.0285 410 0.0285 415 0.0286 420 0.0286 425 0.0285 430 0.0286 435 0.0286 440 0.0285 445 0.0285 450 0.0285 455 0.0285 460 0.0285 465 0.0285 470 0.0286 475 0.0286 480 0.0285 485 0.0285 490 0.0286 495 0.0285 500 0.0285
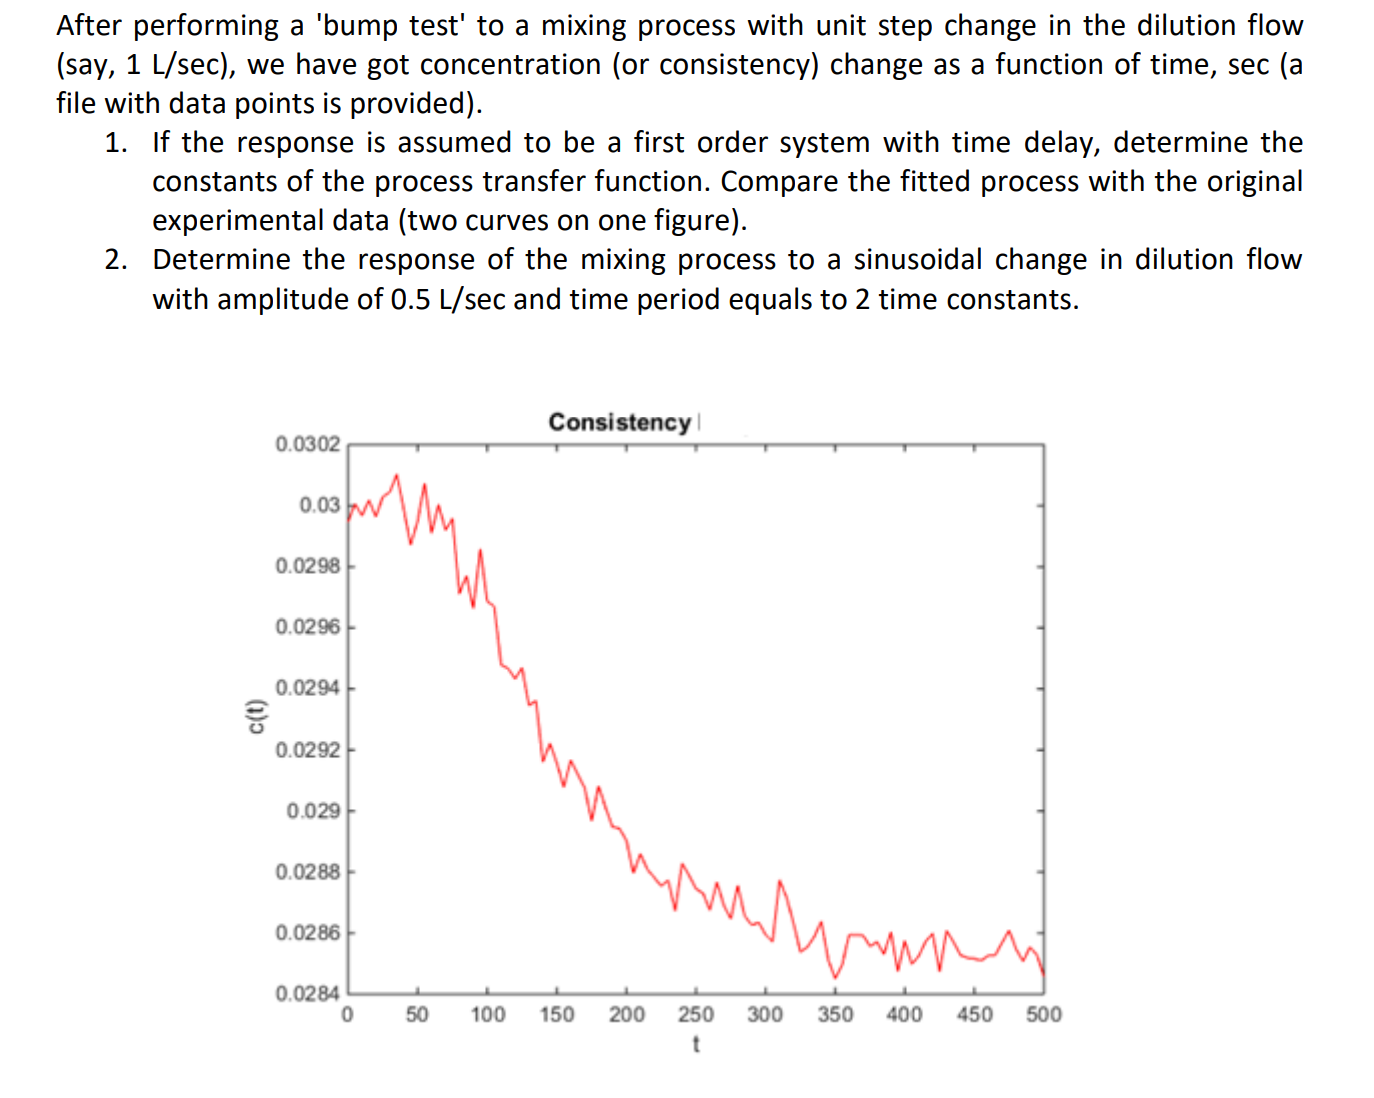
After performing a 'bump test' to a mixing process with unit step change in the dilution flow (say, 1L/sec ), we have got concentration (or consistency) change as a function of time, sec (a file with data points is provided). 1. If the response is assumed to be a first order system with time delay, determine the constants of the process transfer function. Compare the fitted process with the original experimental data (two curves on one figure). 2. Determine the response of the mixing process to a sinusoidal change in dilution flow with amplitude of 0.5L/sec and time period equals to 2 time constants
Step by Step Solution
There are 3 Steps involved in it

Get step-by-step solutions from verified subject matter experts