

Question: Data to use below: All the information to use including numbers and percentages have been provided below. You can also reference this URL here: https://www.imanet.org/-/media/a099d3d3475b4f7d939bc32c1a67d1a5.ashx
Data to use below: All the information to use including numbers and percentages have been provided below. You can also reference this URL here: https://www.imanet.org/-/media/a099d3d3475b4f7d939bc32c1a67d1a5.ashx to get more information if needed as this is the main source of the data below.
5 plant types: Natural Gas, Nuclear, Wind, Solar, Coal
Last year, TVA generated the majority of needed electricity using fossil fuel plants (55%), nuclear plants (28%), hydropower plants (4%), natural gas plants (1%), and renewable sources (1%). In addition, TVA purchased 11% of the needed power from other providers, since TVA generation assets were unable to meet the needs of the valley. Of the costs associated with generating electricity last year, 92% came from two sources: fossil fuel costs and purchased power. Nuclear power production is TVAs most efficient production process (providing 28% of the electricity generated last year, but only accounting for 7% of total costs). Electricity generated using hydropower and renewable sources is the least expensive. (having zero input cost), but it is also the least efficient and has reliability issues.
The energy needs in the Tennessee Valley have grown at more than 2.5% per year for the last 20 years. Demand is expected to continue to grow at about 1% per year over the next 20 years, even with the recent economic downturn slowing things considerably in the short term. TVAs overall goal is to reduce energy use during times when the demand for power is highestoften referred to as the peakby about 5% by the end of 2014. TVA is targeting total energy efficiency savings to be about 3.5% of sales by 2017, which would roughly translate to 0.1% annual load growth to that period.
Coal accounted for over 40% of power generation in the U. S. in 2011.
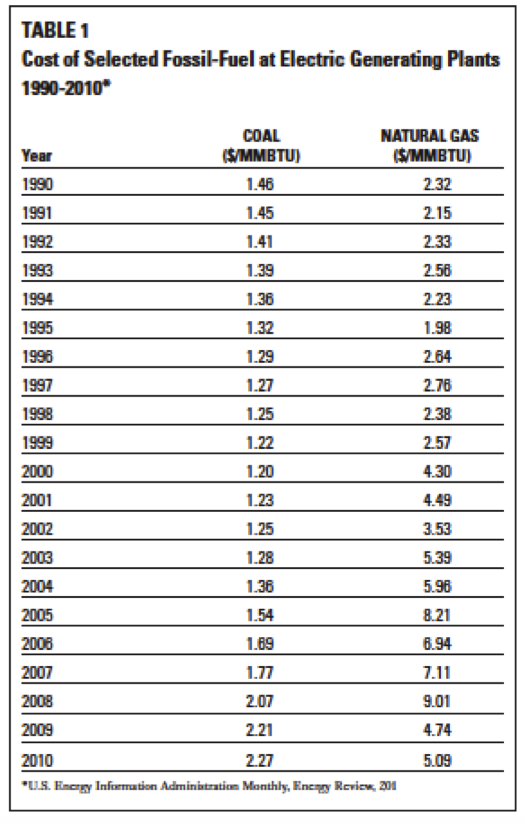
Natural gas, which fuels combined cycles, has had significantly greater price volatility when compared to coal in recent years, and carbon legislation could add about 25% to the cost.
Table 1 compares coal and natural gas prices from 1990 to 2010.
Nuclear power supplied almost 20% of the nations electricity in 2011.
Wind supplied 3% of total U.S. power in 2011. Assuming no changes to current law and regulation, the Energy Information Administration estimates an increase to 20% by 2030.
Solar panels would take a great deal of land area to produce large quantities of energyabout 2 acres to provide 1 MW of generation. To match the energy of a nuclear unit, it would take around 4,000 acres of solar panels.
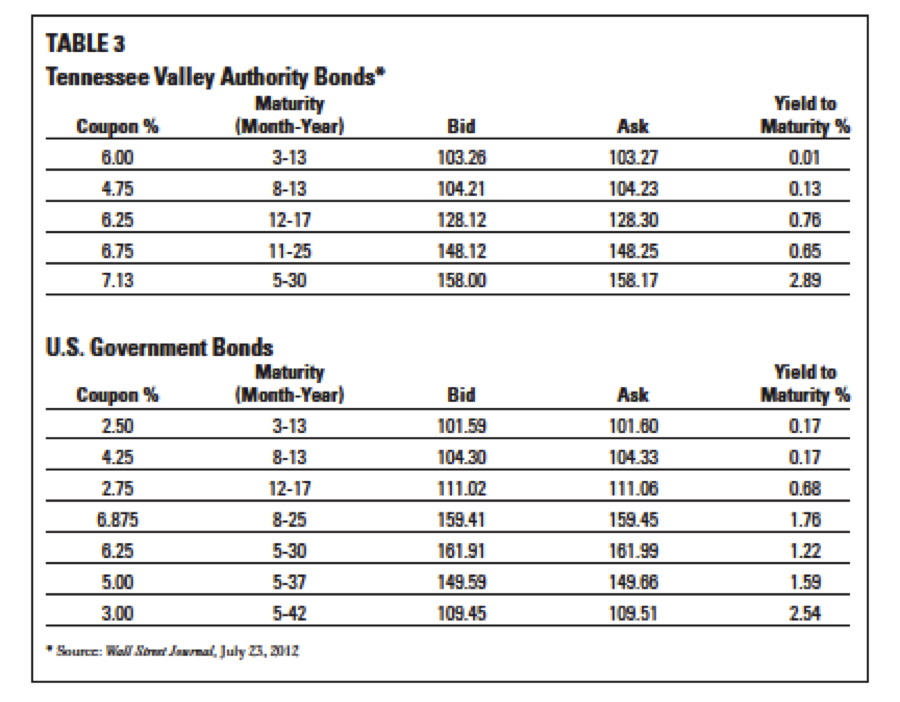
TVAs long-term debt ceiling, set by the U. S. Congress, is $30 billion, however. The ceiling has not been raised in the last four decades. Currently, long-term debt (traditionally reserved for capital projects) remains almost $9 billion, despite several years of debt-reduction efforts. TVAs outstanding long-term debt portfolio averages 5.5%. Although TVA has issued debt with maturities of up to 50 years in the past, the current economic climate will limit new issues to maturities of 15 to 30 years. Given the longer-termed asset life of most of the generation alternatives, Morgan believes that a new 30-year debt issue would be used to fund capital construction.
From the most recent 10-K, Morgan knows that TVA currently has a 37,188 MW capacity; about 40% of capacity is generated from coal and the remainder is generated primarily by nuclear, hydro, and natural gas plants. Less than 1 percent of current capacity is from renewable resources.
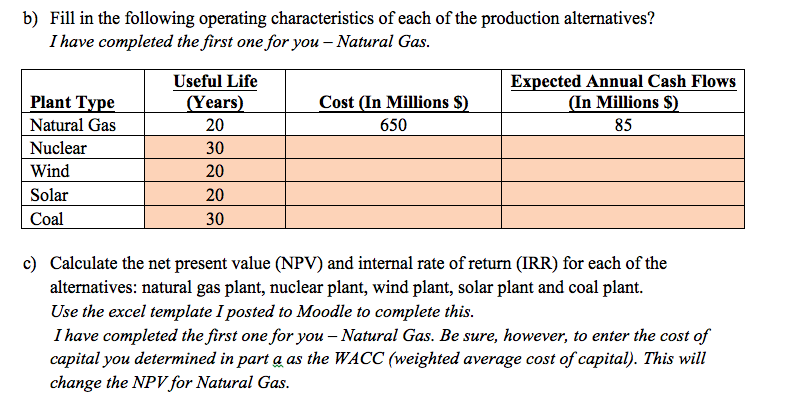
Morgan wonders whether it would be better to go with longer-lived assets such as advanced nuclear or pulverized coal plants with expected lives of 30 years from the day construction is started, or shorter-lived assets such as advanced natural gas combined cycle, wind generation, or solar photovoltaic plants to take advantage of expected improvements in technology and production efficiency. Each of these alternatives has an expected life of 20 years. The $5.5 billion cost of a nuclear plant dwarfs the other alternatives and also has the longest construction time (4 years). A coal plant is less expensive to build (costing roughly one-third as much--$1.8 billion), but takes almost as long to build (3 years). Although much less expensive to construct ($650 million), a natural gas plant still requires 2.5 years for construction. Both of the renewable energy alternatives have short construction times (1 year); the costs differ significantly. The solar plant cost of $300 million is 20 times the cost of a wind plant ($15 million). The alternative sources also have different production capacities. Coal and nuclear plants have significant production capacities (2,300 and 2,000 MW per year, respectively). The other alternatives have lower capacities. The gas plants capacity is 720 MW per year, the wind plants capacity is 150 MW per year, and the solar plants capacity is 100 MW per year. Given the long-lived nature of uranium, the nuclear plants expected cash flow of $680 million per year is significantly higher than the other alternatives. The relatively high cost of production inputs used in the coal and natural gas plants reduces the expected cash flows from each of these plants to $97 million and $85 million, respectively. The expected yearly cash flow from the wind plant is $2 million; the yearly cash flow from the solar plant is $3 million. TVA recently revealed plans to retire multiple coal units by 2018 to comply with its goal to be a leader of clean energy. TVA will need to replace 5,670 MW of generation before these coal units are retired. Half of this generation will be met by converting the old coal plants with combustion turbines. At least 70% of the remaining needed capacity will be met with new base load generation; the remainder can be from peaking or intermittent transmission.
Question:
a)Evaluate the five alternative production projects using traditional discounted cash flow analysis:
What is the appropriate cost of capital for this case? Support your reasoning.
Note that the marginal cost of capital is the appropriate input for capital budgeting decisions. This rate should best estimate of the current cost of raising additional debt of similar risk.
| Year | Natural Gas Plant Cash Flows (In Millions $) | Nuclear Plant Cash Flows (In Millions $) | Wind Plant Cash Flows (In Millions $) | Solar Plant Cash Flows (In Millions $) | Coal Plant Cash Flows (In Millions $) |
|---|---|---|---|---|---|
| 0 | (650) | ||||
| 1 | 0 | ||||
| 2 | 0 | ||||
| 3 | 42.5 | ||||
| 4 | 85 | ||||
| 5 | 85 | ||||
| 6 | 85 | ||||
| 7 | 85 | ||||
| 8 | 85 | ||||
| 9 | 85 | ||||
| 10 | 85 | ||||
| 11 | 85 | ||||
| 12 | 85 | ||||
| 13 | 85 | ||||
| 14 | 85 | ||||
| 15 | 85 | ||||
| 16 | 85 | ||||
| 17 | 85 | ||||
| 18 | 85 | ||||
| 19 | 85 | ||||
| 20 | 85 | ||||
| 21 | 0 | ||||
| 22 | 0 | ||||
| 23 | 0 | ||||
| 24 | 0 | ||||
| 25 | 0 | ||||
| 26 | 0 | ||||
| 27 | 0 | ||||
| 28 | 0 | ||||
| 29 | 0 | ||||
| 30 | 0 |
WACC = ? MUST ENTER Cost of Capital for NPV computations in spreadsheet below to calculate. I have provided Natural gas below, fill out the remaining.
| NPV | $837.50 | ||||
| IRR | 7.99% |
d)
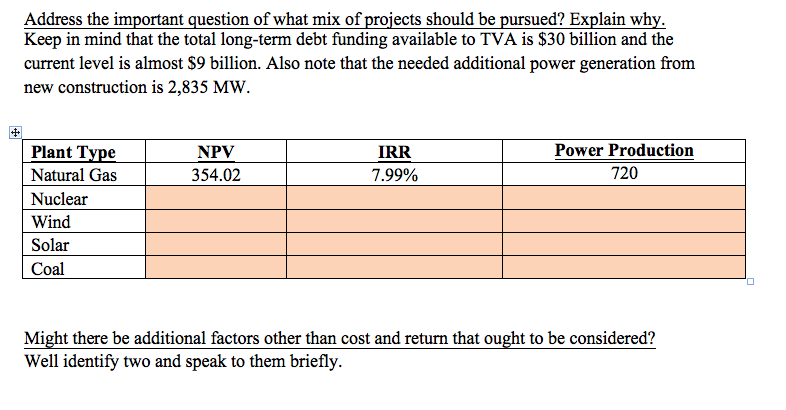
TABLE 1 Cost of Selected Fossil-Fuel at Electric Generating Plants 1990-2010 NATURAL GAS SMMBTU COAL S/MMBTU Year 1990 1991 1992 1993 1994 1995 1998 1997 1998 1999 1.4B 1.45 1.41 1.39 1.36 1.32 1.29 1.27 1.25 1.22 1.20 1.23 1.25 .28 1.36 1.54 1.69 1.77 2.07 2.21 227 232 2.15 233 2.56 2.23 1.98 2.64 2.76 2.38 257 4.30 4.49 3.53 5.39 5.96 8.21 6.94 7.11 9.01 4.74 5.09 2001 2002 2003 2004 2005 2008 2008 2009 2010 "US Enagy Information Adrnmatration Minthly, Enc gy Revic 201 TABLE 1 Cost of Selected Fossil-Fuel at Electric Generating Plants 1990-2010 NATURAL GAS SMMBTU COAL S/MMBTU Year 1990 1991 1992 1993 1994 1995 1998 1997 1998 1999 1.4B 1.45 1.41 1.39 1.36 1.32 1.29 1.27 1.25 1.22 1.20 1.23 1.25 .28 1.36 1.54 1.69 1.77 2.07 2.21 227 232 2.15 233 2.56 2.23 1.98 2.64 2.76 2.38 257 4.30 4.49 3.53 5.39 5.96 8.21 6.94 7.11 9.01 4.74 5.09 2001 2002 2003 2004 2005 2008 2008 2009 2010 "US Enagy Information Adrnmatration Minthly, Enc gy Revic 201
Step by Step Solution
There are 3 Steps involved in it

Get step-by-step solutions from verified subject matter experts