

Question: data: TP PD EO16 GE MHV 2.67 5.71 69.02 30.3 1.48 2.25 4.37 72.98 43.3 1.44 3.12 10.27 64.94 32.0 2.11 5.14 7.44 71.29 24.5
data:
TP PD EO16 GE MHV 2.67 5.71 69.02 30.3 1.48 2.25 4.37 72.98 43.3 1.44 3.12 10.27 64.94 32.0 2.11 5.14 7.44 71.29 24.5 1.85 5.54 9.25 74.94 31.0 2.23 5.04 4.84 53.61 48.2 1.60 3.14 4.82 67.00 37.6 1.52 2.43 2.40 67.20 36.8 1.40 5.38 4.30 83.03 19.7 2.07 7.34 2.73 72.60 24.5 1.42 4.94 4.66 64.32 27.7 1.42 4.82 4.26 82.64 20.3 1.46 5.02 4.17 84.25 20.6 1.42 3.37 1.00 69.93 16.4 1.17 3.63 6.40 70.31 29.0 2.00 7.43 6.00 70.53 37.7 1.44 2.20 10.59 69.85 41.7 2.01 7.16 4.71 79.44 33.0 1.55 6.33 2.88 66.24 38.1 1.73 2.57 1.85 67.25 33.4 1.18 6.38 1.56 63.00 18.2 0.93 5.34 3.41 72.57 20.1 1.66 4.87 5.20 75.13 16.5 3.64 2.04 4.83 67.78 17.4 1.49 5.48 1.34 77.43 21.6 1.32 7.77 5.32 58.57 31.2 3.21 6.29 2.60 64.32 27.4 1.78 6.38 3.71 78.61 34.1 1.30 5.76 4.06 83.77 31.4 1.52 6.03 3.10 76.04 25.0 1.08 5.09 1.85 74.65 24.1 0.97 4.36 1.67 65.43 23.7 1.07 3.07 2.00 68.03 26.2 1.19 1.82 1.13 49.50 21.9 1.62 3.31 0.94 74.75 26.5 1.12 3.45 0.72 65.99 22.0 1.20 1.74 0.97 60.24 22.0 1.17 1.81 1.54 70.05 24.4 1.00 5.59 1.66 77.96 17.1 1.30 3.72 1.69 82.40 16.3 1.52 3.39 1.24 67.17 27.7 1.03 2.25 2.80 70.81 23.4 1.14 3.31 1.30 71.30 19.2 1.21 5.27 1.20 73.08 30.3 1.35 3.26 1.02 74.36 16.5 1.23 6.76 1.53 78.37 22.6 1.33 2.92 4.42 58.50 68.5 2.25 1.64 16.70 64.61 49.4 3.13 1.36 14.26 66.42 22.5 2.80 3.58 3.38 65.57 26.1 1.31 3.38 2.17 66.10 22.6 1.44 7.25 1.16 78.52 23.6 1.50 5.44 2.93 73.59 22.3 1.65 5.83 4.47 77.33 26.2 2.16 3.74 2.26 79.70 20.2 1.58 9.21 2.36 74.58 21.8 1.72 2.14 6.30 86.54 17.4 2.80 6.62 4.79 78.84 20.0 2.33 4.24 5.82 71.39 27.1 1.69 4.72 4.71 78.01 20.6 1.55 6.48 4.93 74.23 20.9 1.98
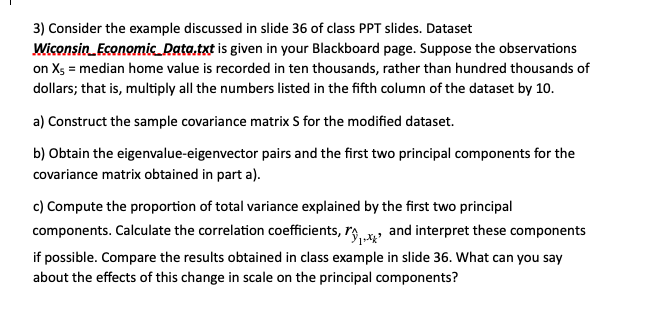
3) Consider the example discussed in slide 36 of class PPT slides. Dataset Wiconsin Economic Data.txt is given in your Blackboard page. Suppose the observations on Xs = median home value is recorded in ten thousands, rather than hundred thousands of dollars; that is, multiply all the numbers listed in the fifth column of the dataset by 10. a) Construct the sample covariance matrix S for the modified dataset. b) Obtain the eigenvalue-eigenvector pairs and the first two principal components for the covariance matrix obtained in part a). c) Compute the proportion of total variance explained by the first two principal components. Calculate the correlation coefficients, r,-43 and interpret these components if possible. Compare the results obtained in class example in slide 36. What can you say about the effects of this change in scale on the principal components? 3) Consider the example discussed in slide 36 of class PPT slides. Dataset Wiconsin Economic Data.txt is given in your Blackboard page. Suppose the observations on Xs = median home value is recorded in ten thousands, rather than hundred thousands of dollars; that is, multiply all the numbers listed in the fifth column of the dataset by 10. a) Construct the sample covariance matrix S for the modified dataset. b) Obtain the eigenvalue-eigenvector pairs and the first two principal components for the covariance matrix obtained in part a). c) Compute the proportion of total variance explained by the first two principal components. Calculate the correlation coefficients, r,-43 and interpret these components if possible. Compare the results obtained in class example in slide 36. What can you say about the effects of this change in scale on the principal components
Step by Step Solution
There are 3 Steps involved in it

Get step-by-step solutions from verified subject matter experts