

Question: Data Visualization 4-1 Operating Cash Flows vs. Net Income You are Controller for the Transportation Division of Second Data Incorporated A new manager for the
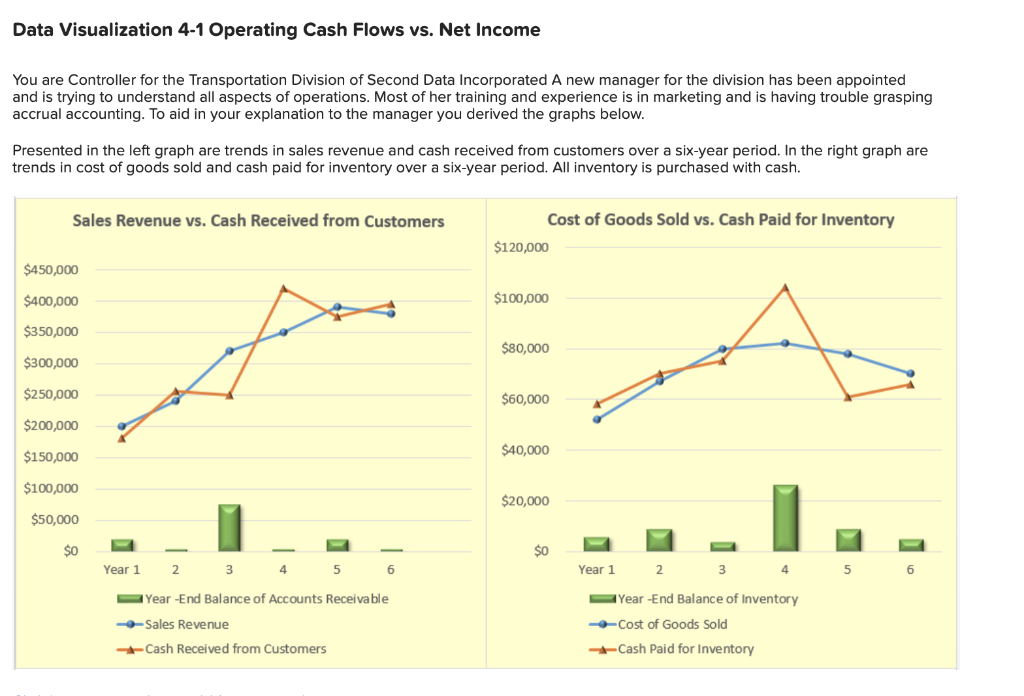
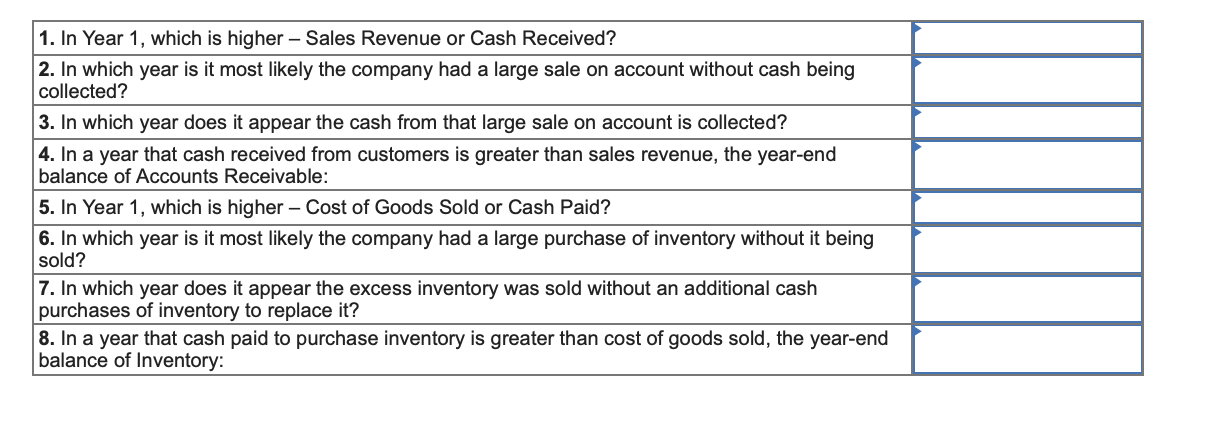
Data Visualization 4-1 Operating Cash Flows vs. Net Income You are Controller for the Transportation Division of Second Data Incorporated A new manager for the division has been appointed and is trying to understand all aspects of operations. Most of her training and experience is in marketing and is having trouble grasping accrual accounting. To aid in your explanation to the manager you derived the graphs below. Presented in the left graph are trends in sales revenue and cash received from customers over a six-year period. In the right graph are trends in cost of goods sold and cash paid for inventory over a six-year period. All inventory is purchased with cash. \begin{tabular}{|l|l|} \hline 1. In Year 1, which is higher - Sales Revenue or Cash Received? \\ \hline 2.Inwhichyearisitmostlikelythecompanyhadalargesaleonaccountwithoutcashbeingcollected? \\ \hline 3. In which year does it appear the cash from that large sale on account is collected? \\ \hline 4.Inayearthatcashreceivedfromcustomersisgreaterthansalesrevenue,theyear-endbalanceofAccountsReceivable: \\ \hline 5. In Year 1, which is higher - Cost of Goods Sold or Cash Paid? \\ \hline 6.Inwhichyearisitmostlikelythecompanyhadalargepurchaseofinventorywithoutitbeingsold? \\ \hline 7.Inwhichyeardoesitappeartheexcessinventorywassoldwithoutanadditionalcashpurchasesofinventorytoreplaceit? \\ \hline 8.Inayearthatcashpaidtopurchaseinventoryisgreaterthancostofgoodssold,theyear-endbalanceofInventory: \\ \hline \end{tabular}
Step by Step Solution
There are 3 Steps involved in it

Get step-by-step solutions from verified subject matter experts