

Question: Data Visualization (Chapter 8) Choose one type of chart from chapter 8 and use it to describe a real world situation. You can hand draw
 Data Visualization (Chapter 8)
- Choose one type of chart from chapter 8 and use it to describe a real world situation. You can hand draw the chart or use a tool to generate one.
- NOTE: You must show an image . If you hand draw the chart, you can take a picture of it and show it .
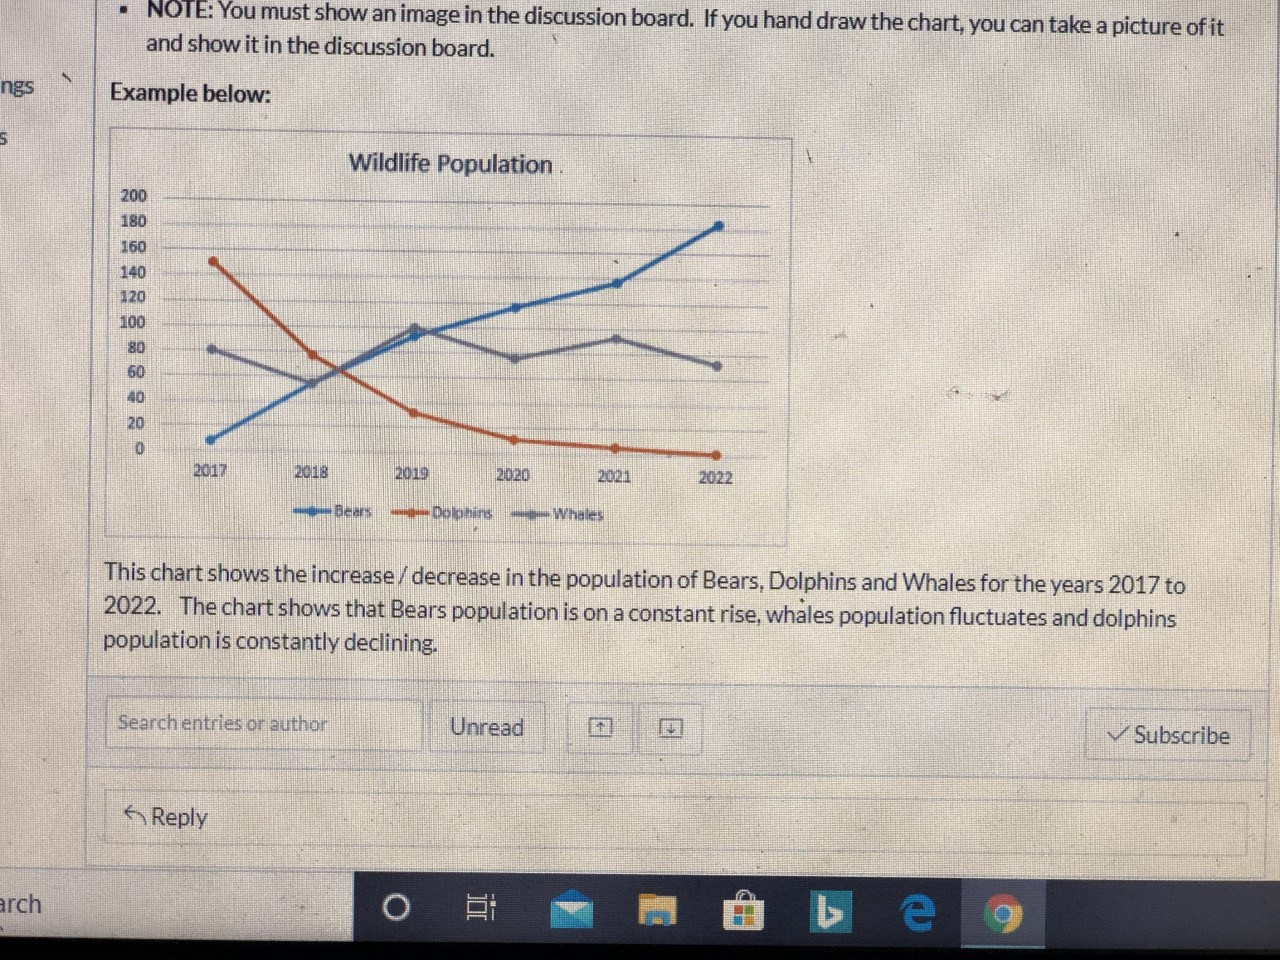
Example below:
This chart shows the increase / decrease in the population of Bears, Dolphins and Whales for the years 2017 to 2022. The chart shows that Bears population is on a constant rise, whales population fluctuates and dolphins population is constantly declining.
use any type of this chart :
1. heat map
2.bar chart
3.histograms and probability distributions
4.line chart
5.area chart
6.scatter plot
7.bubble chart
8.pie chart
9.tree map
10.waterfall chart
11. sankey diagram
12. likert scale
NOTE: You must show an image in the discussion board. If you hand draw the chart, you can take a picture of it and show it in the discussion board. ngs Example below: S Wildlife Population. 200 180 160 140 120 100 80 60 40 20 0 2017 2018 2019 2020 2021 2022 Bears - Dolphins Whales This chart shows the increase/ decrease in the population of Bears, Dolphins and Whales for the years 2017 to 2022. The chart shows that Bears population is on a constant rise, whales population fluctuates and dolphins population is constantly declining. Search entries or author Unread Subscribe Reply arch O eStep by Step Solution
There are 3 Steps involved in it
1 Expert Approved Answer
Step: 1 Unlock

Question Has Been Solved by an Expert!
Get step-by-step solutions from verified subject matter experts
Step: 2 Unlock
Step: 3 Unlock