

Question: Data visualization - the process of displaying data (often in large quantities) in a meaningful fashion to provide insights that will support better decisions. Refer
Data visualization - the process of displaying data (often in large quantities) in a meaningful fashion to provide insights that will support better decisions. Refer to the article describing the use of analytics at the Cincinnati Zoo and Botanical Garden Download analytics at the Cincinnati Zoo and Botanical Garden. Apply insights from the article to either Ch 3 # 18 OR Ch 3#19 (choose one). These open-ended questions have many options. Effective responses should have well-designed and formatted charts and explain the rationale behind your choices.
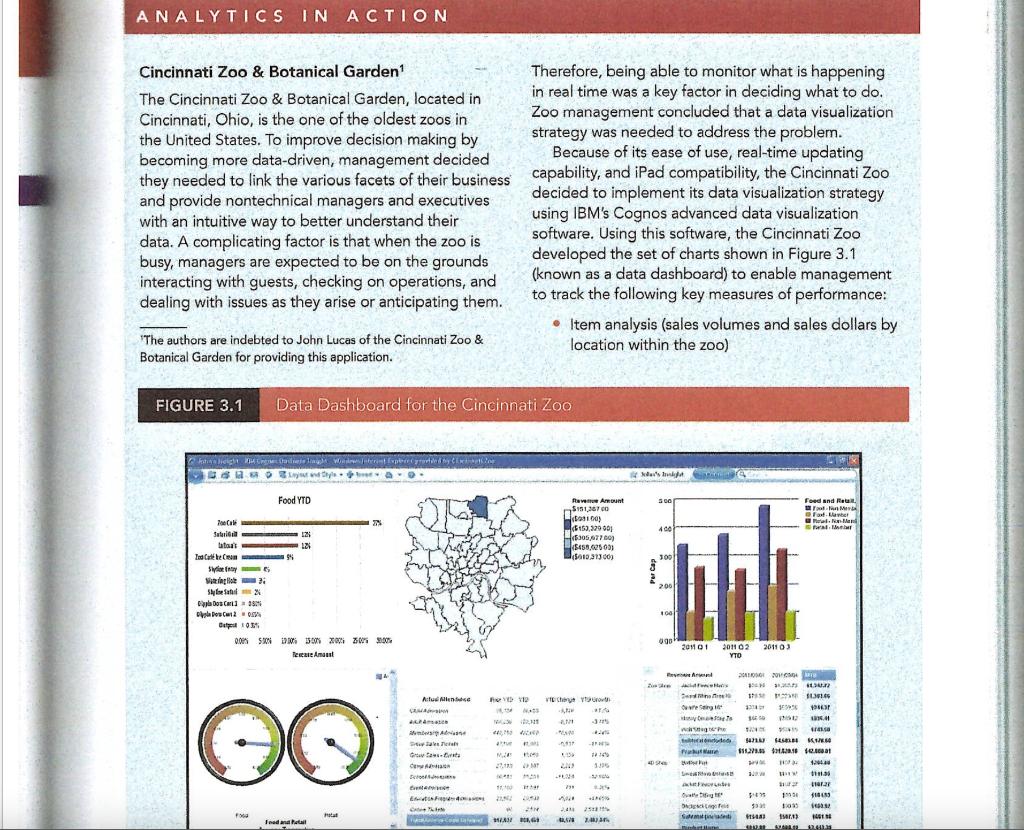

ANALYTICS IN ACTION Cincinnati Zoo & Botanical Garden The Cincinnati Zoo & Botanical Garden, located in Cincinnati, Ohio, is the one of the oldest zoos in the United States. To improve decision making by becoming more data-driven, management decided they needed to link the various facets of their business and provide nontechnical managers and executives with an intuitive way to better understand their data. A complicating factor is that when the zoo is busy, managers are expected to be on the grounds interacting with guests, checking on operations, and dealing with issues as they arise or anticipating them. The authors are indebted to John Lucas of the Cincinnati Zoo & Botanical Garden for providing this application. FIGURE 3.1 Data Dashboard for the Cincinnati Zoo di eight Cagnes Chalets light Wondjeherint Explore Cyroved Wondesjuferint Explore groved by Celbeto Sa raya... Food YTD 700 Cale 27% 12 126 Syy5 Single 2 S2 Dos Carl 38% C20.53% 03 0.00% 50% 19:00 13:00 2000 2500 3000 Testate Anaest MAT Food Star lataa To Cam 1.9% Food and Pa stat Aluence CALAM ALPA Ad Sera Gasts C C EF C Co Therefore, being able to monitor what is happening in real time was a key factor in deciding what to do. Zoo management concluded that a data visualization strategy was needed to address the problem. Because of its ease of use, real-time updating capability, and iPad compatibility, the Cincinnati Zoo decided to implement its data visualization strategy using IBM's Cognos advanced data visualization software. Using this software, the Cincinnati Zoo developed the set of charts shown in Figure 3.1 (known as a data dashboard) to enable management to track the following key measures of performance: Item analysis (sales volumes and sales dollars by location within the zoo) d's bodd Cardina 500 Food and Re - M Fort-Mawber Pel-N-Mani feathe 400 300 200 Revenue Amount $151,267.00 (1100) 153,329 001 530567760) $458,62500) 5012313003 FOYD 11 youth veche Ste 14. MATS MON 442,355 422 attur Fa MA MOM P 201 2007 SEPE AMI MA 0915 ADA 195/6 345 25 -SPORTH 74749 230 1.05 1201 24 11,00 achar 791 $35 21862 20000 201 **** W 244 2,41 252 AG $2.5/8 240236 2 100 99044 40 Ste 2011 01 BA 2011 02 2011 03 YTO 2016 201 1637 $75 $1.361.46 3389 1983 10000 PRZ 1305.41 955 trasa T 54714 646 $15.278.45 $12.16 $42.001 HOP 12040 www 1113 auror (14727 2:43 150.00 $18455 333 1033 142.32 $15443 1401 107.13 40.3 52.005.12 $2.613 Okwire Saing 167 70 wg Pe de Future B Fot Sen Ader Dagskage fel Sempe Chapter 3 Data Visualization Geoanalytics (using maps and displays of where the day's visitors are spending their time at the zoo) Customer spending Cashier sales performance. Sales and attendance data versus weather patterns Performance of the zoo's loyalty rewards program An iPad mobile application was also developed to enable the zoo's managers to be out on the grounds and still see and anticipate occurrences in real time. The Cincinnati Zoo's iPad application, shown in Figure 3.2, provides managers with access to the following information: Real-time attendance data, including what types of guests are coming to the zoo (members, nonmembers, school groups, and so on) FIGURE 3.2 78 Ciase 200 Hounty 0 Year To The Cincinnati Zoo iPad Data Dashboard 11:27 PM Cincy+Zoo+Insight Daily Report IN PA (a 30 Top 10 Food Items KY 243 OH 1072 WV Real-time analysis showing which locations are busiest and which items are selling the fastest inside the zoo Real-time geographical representation of where the zoo's visitors live Having access to the data shown in Figures 3.1 and 3.2 allows the zoo managers to make better decisions about staffing levels, which items to stock based on weather and other conditions, and how to better target advertising based on geodemographics. The impact that data visualization has had on the zoo has been substantial. Within the first year of use, the system was directly responsible for revenue growth of over $500,000, increased visitation to the zoo, enhanced customer service, and reduced marketing costs. 705 Membership Admission 660 49 Child Admission 16 12 40 Education Program Admissions 28 Adult Admission 11 26 Group Sales Tickets D (4 Top 5 attendance Cities - Ohio CINCINNATI WEST CHESTER HAMILTON MASON LOVELAND Top 10 Retall items ANALYTICS IN ACTION Cincinnati Zoo & Botanical Garden The Cincinnati Zoo & Botanical Garden, located in Cincinnati, Ohio, is the one of the oldest zoos in the United States. To improve decision making by becoming more data-driven, management decided they needed to link the various facets of their business and provide nontechnical managers and executives with an intuitive way to better understand their data. A complicating factor is that when the zoo is busy, managers are expected to be on the grounds interacting with guests, checking on operations, and dealing with issues as they arise or anticipating them. The authors are indebted to John Lucas of the Cincinnati Zoo & Botanical Garden for providing this application. FIGURE 3.1 Data Dashboard for the Cincinnati Zoo di eight Cagnes Chalets light Wondjeherint Explore Cyroved Wondesjuferint Explore groved by Celbeto Sa raya... Food YTD 700 Cale 27% 12 126 Syy5 Single 2 S2 Dos Carl 38% C20.53% 03 0.00% 50% 19:00 13:00 2000 2500 3000 Testate Anaest MAT Food Star lataa To Cam 1.9% Food and Pa stat Aluence CALAM ALPA Ad Sera Gasts C C EF C Co Therefore, being able to monitor what is happening in real time was a key factor in deciding what to do. Zoo management concluded that a data visualization strategy was needed to address the problem. Because of its ease of use, real-time updating capability, and iPad compatibility, the Cincinnati Zoo decided to implement its data visualization strategy using IBM's Cognos advanced data visualization software. Using this software, the Cincinnati Zoo developed the set of charts shown in Figure 3.1 (known as a data dashboard) to enable management to track the following key measures of performance: Item analysis (sales volumes and sales dollars by location within the zoo) d's bodd Cardina 500 Food and Re - M Fort-Mawber Pel-N-Mani feathe 400 300 200 Revenue Amount $151,267.00 (1100) 153,329 001 530567760) $458,62500) 5012313003 FOYD 11 youth veche Ste 14. MATS MON 442,355 422 attur Fa MA MOM P 201 2007 SEPE AMI MA 0915 ADA 195/6 345 25 -SPORTH 74749 230 1.05 1201 24 11,00 achar 791 $35 21862 20000 201 **** W 244 2,41 252 AG $2.5/8 240236 2 100 99044 40 Ste 2011 01 BA 2011 02 2011 03 YTO 2016 201 1637 $75 $1.361.46 3389 1983 10000 PRZ 1305.41 955 trasa T 54714 646 $15.278.45 $12.16 $42.001 HOP 12040 www 1113 auror (14727 2:43 150.00 $18455 333 1033 142.32 $15443 1401 107.13 40.3 52.005.12 $2.613 Okwire Saing 167 70 wg Pe de Future B Fot Sen Ader Dagskage fel Sempe Chapter 3 Data Visualization Geoanalytics (using maps and displays of where the day's visitors are spending their time at the zoo) Customer spending Cashier sales performance. Sales and attendance data versus weather patterns Performance of the zoo's loyalty rewards program An iPad mobile application was also developed to enable the zoo's managers to be out on the grounds and still see and anticipate occurrences in real time. The Cincinnati Zoo's iPad application, shown in Figure 3.2, provides managers with access to the following information: Real-time attendance data, including what types of guests are coming to the zoo (members, nonmembers, school groups, and so on) FIGURE 3.2 78 Ciase 200 Hounty 0 Year To The Cincinnati Zoo iPad Data Dashboard 11:27 PM Cincy+Zoo+Insight Daily Report IN PA (a 30 Top 10 Food Items KY 243 OH 1072 WV Real-time analysis showing which locations are busiest and which items are selling the fastest inside the zoo Real-time geographical representation of where the zoo's visitors live Having access to the data shown in Figures 3.1 and 3.2 allows the zoo managers to make better decisions about staffing levels, which items to stock based on weather and other conditions, and how to better target advertising based on geodemographics. The impact that data visualization has had on the zoo has been substantial. Within the first year of use, the system was directly responsible for revenue growth of over $500,000, increased visitation to the zoo, enhanced customer service, and reduced marketing costs. 705 Membership Admission 660 49 Child Admission 16 12 40 Education Program Admissions 28 Adult Admission 11 26 Group Sales Tickets D (4 Top 5 attendance Cities - Ohio CINCINNATI WEST CHESTER HAMILTON MASON LOVELAND Top 10 Retall items
Step by Step Solution
There are 3 Steps involved in it

Get step-by-step solutions from verified subject matter experts