

Question: Data Visualization Types Worksheet Based on the multiple visual representations for different data sets in the Professional Development Opportunities: Charts and Graphs presentation, complete the


Data Visualization Types Worksheet
Based on the multiple visual representations for different data sets in theProfessional Development Opportunities: Charts and Graphs presentation,complete the table below using complete sentences and according to the following guidelines:
- Column 1 provides the data sets shown in visual representations in the presentation.
- In Column 2, identify the type of data included in each data set.
- In Column 3, identify the type(s) of chart used to represent each data set.
- In Column 4, write description of the data information you observed from each visual representation. Cite specific examples.
- In Column 5, write description of what each visual representation doesnot show about the data in the presentation. What additional questions does it make you wonder? Explain your rationale with specific examples.
| Data Set Shown in the Visual Representation | Type of Data (Nominal, Ordinal, Interval, or Ratio) | Chart Type(s) Used (Histogram, Box & Whisker, Scatter Plot, Stacked Bar Chart, or Pie Chart) | What You Learned From the Visual Representation | What You Do Not See from the Visual Representation |
|---|---|---|---|---|
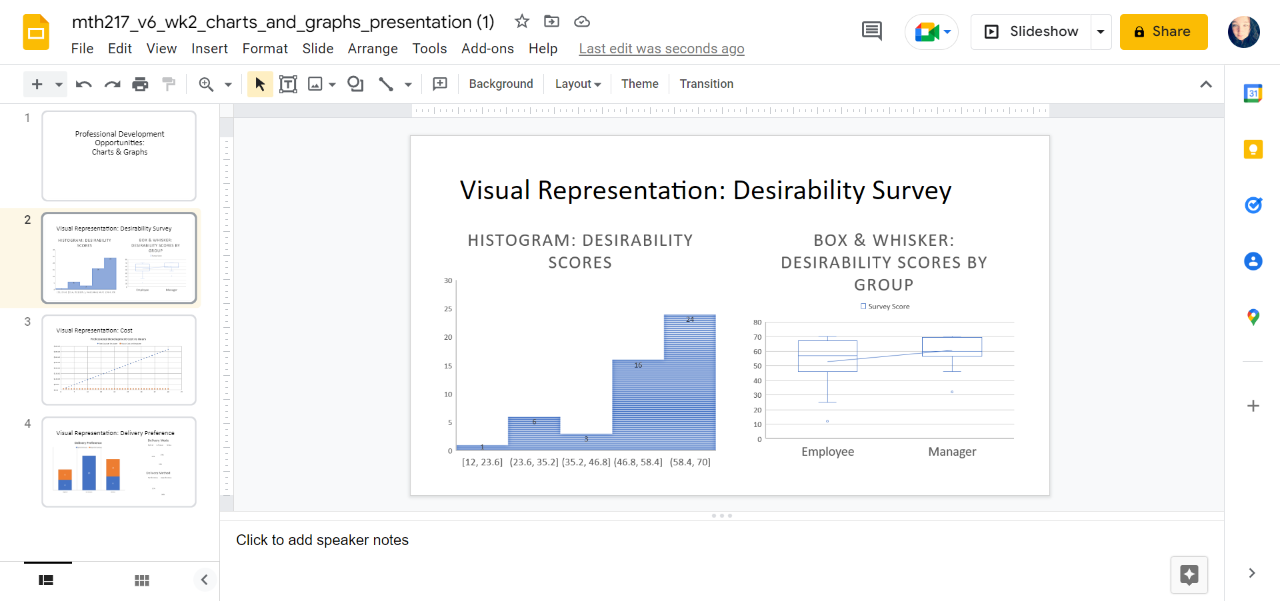
| Desirability Survey | ||||
| Cost | ||||
| Delivery Preference |
Professional Development Opportunities: Charts and Graphs presentation:

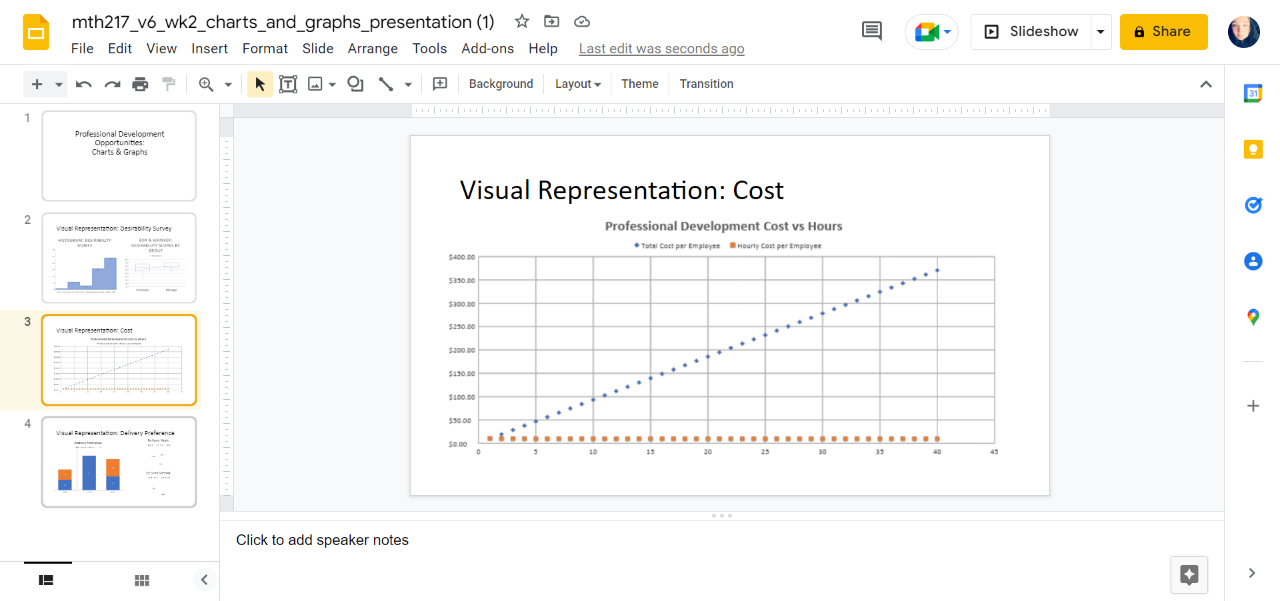
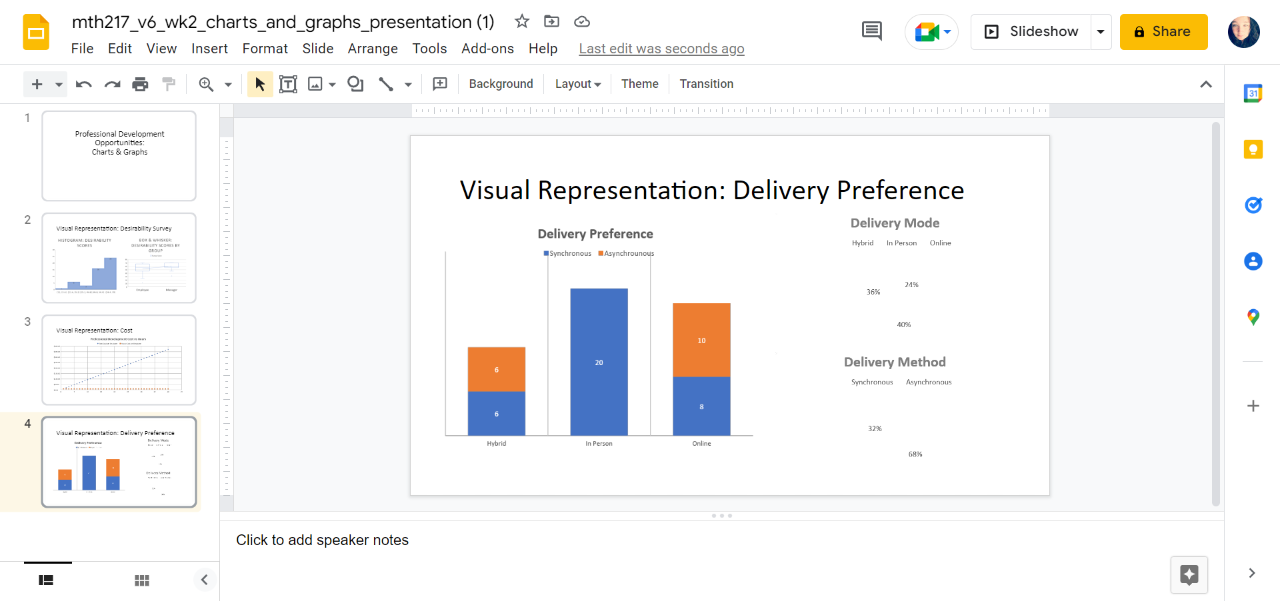
mth217_vo_wk2_charts_and_graphs_presentation (1) * @ @ Slideshow a Share File Edit View Insert Format Slide Arrange Tools Add-ons Help Last edit was seconds ago + + nab - Q- *no-9\\ Background Layout Theme Transition 31 Professional Development Opportunities: Charts & Graphs Visual Representation: Desirability Survey C 2 Waual Representationc Desirability Survey HITOGRAM CLI AMUTE HISTOGRAM: DESIRABILITY BOX & WHISKER: SCORES DESIRABILITY SCORES BY 30 GROUP 75 Survey Score 3 Visual Representation: Cost 70 60 50 AD 10 90 20 + 10 Visual Representation Delivery Preference Employee Manager [12, 23.6] (23.6, 35.2] (35.2, 46.8] (46.8, 58.4] (58.4, 70] Click to add speaker notes mth217_vo_wk2_charts_and_graphs_presentation (1) * @ @ Slideshow a Share File Edit View Insert Format Slide Arrange Tools Add-ons Help Last edit was seconds ago + + nab - Q- *no-9\\ Background Layout Theme Transition 31 Professional Development Opportunities: Charts & Graphs Visual Representation: Cost C 2 Waual Representavore Desirability Survey Professional Development Cost vs Hours Total Cost per Employee Hourly Cost per Employee $400.00 $330.00 $300.00 3 Vous! Representation Cost $230.00 $200.00 $130.80 $100.0 + $36 08 Visual Representation Delivery Preference 10 15 20 23 30 35 Click to add speaker notes + >mth217_vo_wk2_charts_and_graphs_presentation (1) * @ @ Slideshow a Share File Edit View Insert Format Slide Arrange Tools Add-ons Help Last edit was seconds ago + + nab - Q- *no-9\\ Background Layout Theme Transition 31 Professional Development Opportunities: Charts & Graphs Visual Representation: Delivery Preference 2 Waual Representationc Desirability Survey Delivery Mode Delivery Preference Hybrid In Person Online Synchronous Asynchronous 36% 3 Waual Representation Cost 10 Delivery Method Synchronous Asynchronous 8 + Visual Representation Delivery Preference Hybrid In Person Online 68K Click to add speaker notes + >
Step by Step Solution
There are 3 Steps involved in it

Get step-by-step solutions from verified subject matter experts