

Question: Data Visualization Types Worksheet Based on the multiple visual representations for different data sets in the Professional Development Opportunities: Charts and Graphs presentation, complete the
Data Visualization Types Worksheet
Based on the multiple visual representations for different data sets in the Professional Development Opportunities: Charts and Graphs presentation, complete the table below using complete sentences and according to the following guidelines:
- Column 1 provides the data sets shown in visual representations in the presentation.
- In Column 2, identify the type of data included in each data set.
- In Column 3, identify the type(s) of chart used to represent each data set.
- In Column 4, write a 25- to 50-word description of the data information you observed from each visual representation. Cite specific examples.
- In Column 5, write a 25- to 50-word description of what each visual representation does not show about the data in the presentation. What additional questions does it make you wonder? Explain your rationale with specific examples.
| Data Set Shown in the Visual Representation | Type of Data (Nominal, Ordinal, Interval, or Ratio) | Chart Type(s) Used (Histogram, Box & Whisker, Scatter Plot, Stacked Bar Chart, or Pie Chart) | What You Learned From the Visual Representation | What You Do Not See from the Visual Representation |
|---|---|---|---|---|
| Desirability Survey | ||||
| Cost | ||||
| Delivery Preference |
Professional Development Opportunities: Charts & Graphs
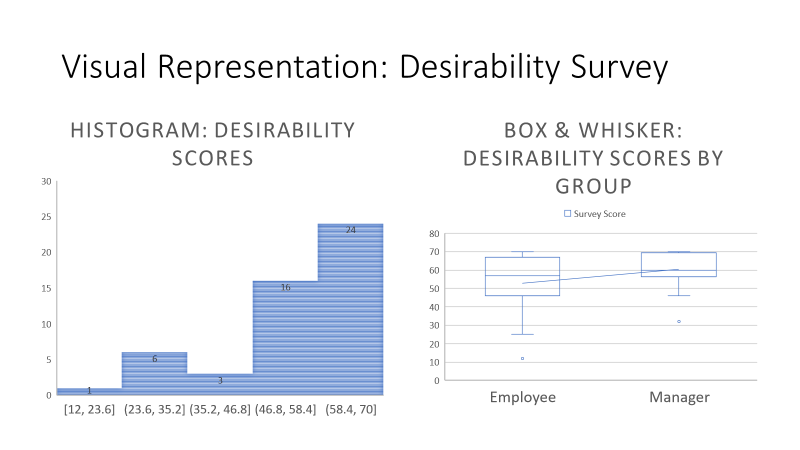
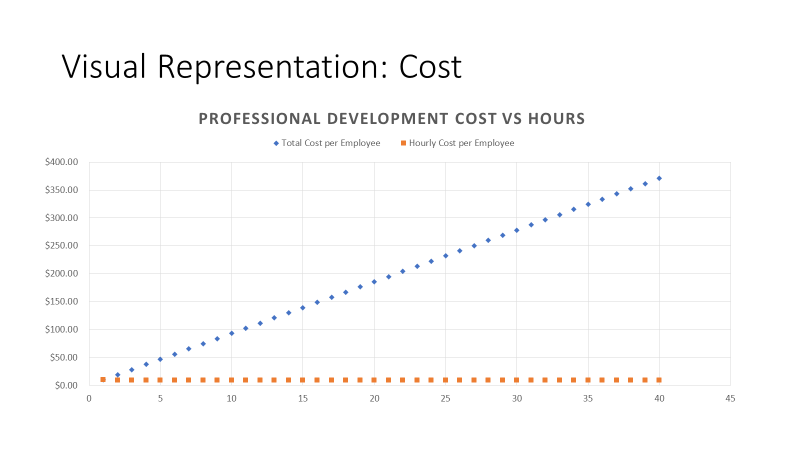
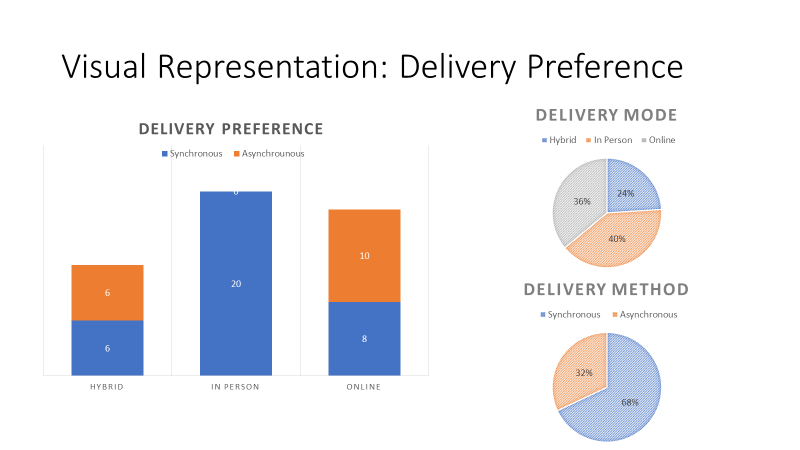
Visual Representation: Desirability Survey HISTOGRAM: DESIRABILITY BOX& WHISKER: SCORES DESIRABILITY SCORES BY 3'\" GROUP 5 U Employee Manager [12. 23.6] [23.6. 35.2] [35.2, 46.3] {46.3, 53.4] [53.4. I'D] Visual Representation: Cost PROFESSIONAL DEVELOPMENT COST VS HOURS * Total Cost per Employee Hourly Cost per Employee 5400.00 $350.00 5300.00 $250.00 $200.00 $150.00 $100.00 $50.00 $0.00 5 10 15 20 25 3.0 35 40 45Visual Representation: Delivery Preference DELIVERY MODE DELIVERY PREFERENCE Hybrid . In Person . Online Synchronous Asynchrounous 36% 10 6 DELIVERY METHOD Synchronous Asynchronous 8 329% HYBRID IN PERSON ONLINE 68%
Step by Step Solution
There are 3 Steps involved in it

Get step-by-step solutions from verified subject matter experts