

Question: Data was collected for 198 randomly selected 10 minute intervals. For each ten-minute interval, the number of people entering the atrium of a large mall
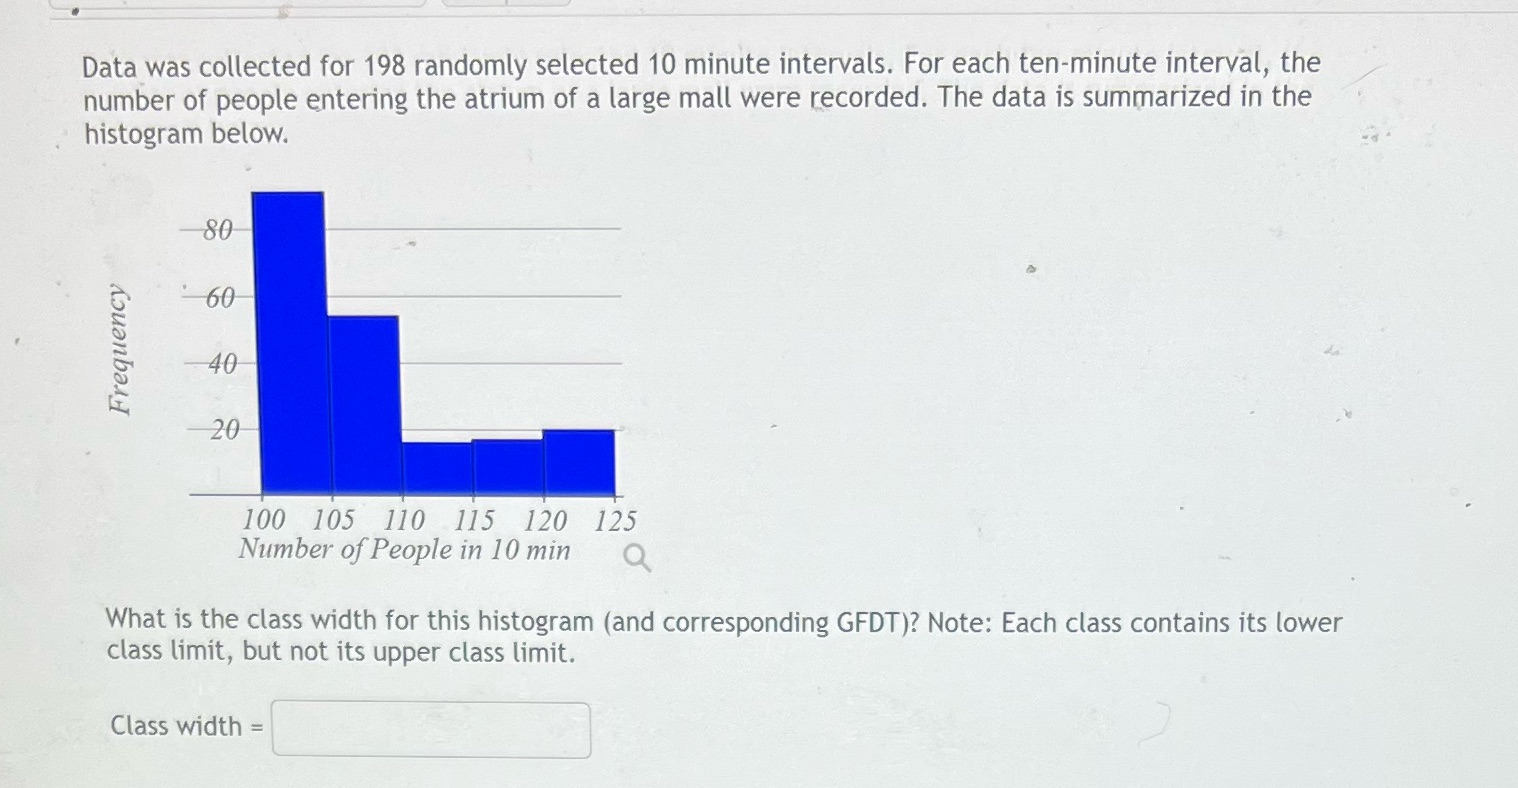
Data was collected for 198 randomly selected 10 minute intervals. For each ten-minute interval, the number of people entering the atrium of a large mall were recorded. The data is summarized in the histogram below. 80 60 Frequency 40 20 100 105 110 115 120 125 Number of People in 10 min Q What is the class width for this histogram (and corresponding GFDT)? Note: Each class contains its lower class limit, but not its upper class limit. Class width =
Step by Step Solution
There are 3 Steps involved in it
1 Expert Approved Answer
Step: 1 Unlock

Question Has Been Solved by an Expert!
Get step-by-step solutions from verified subject matter experts
Step: 2 Unlock
Step: 3 Unlock