

Question: Data were collected from 50 statistics to estimate the relationship between their X = average quiz scores and Y = final exam scores. A simple
Data were collected from 50 statistics to estimate the relationship between their X = average quiz scores and Y = final exam scores. A simple linear regression model was fit to estimate the relationship. The estimated equation and the one-way ANOVA table is given below
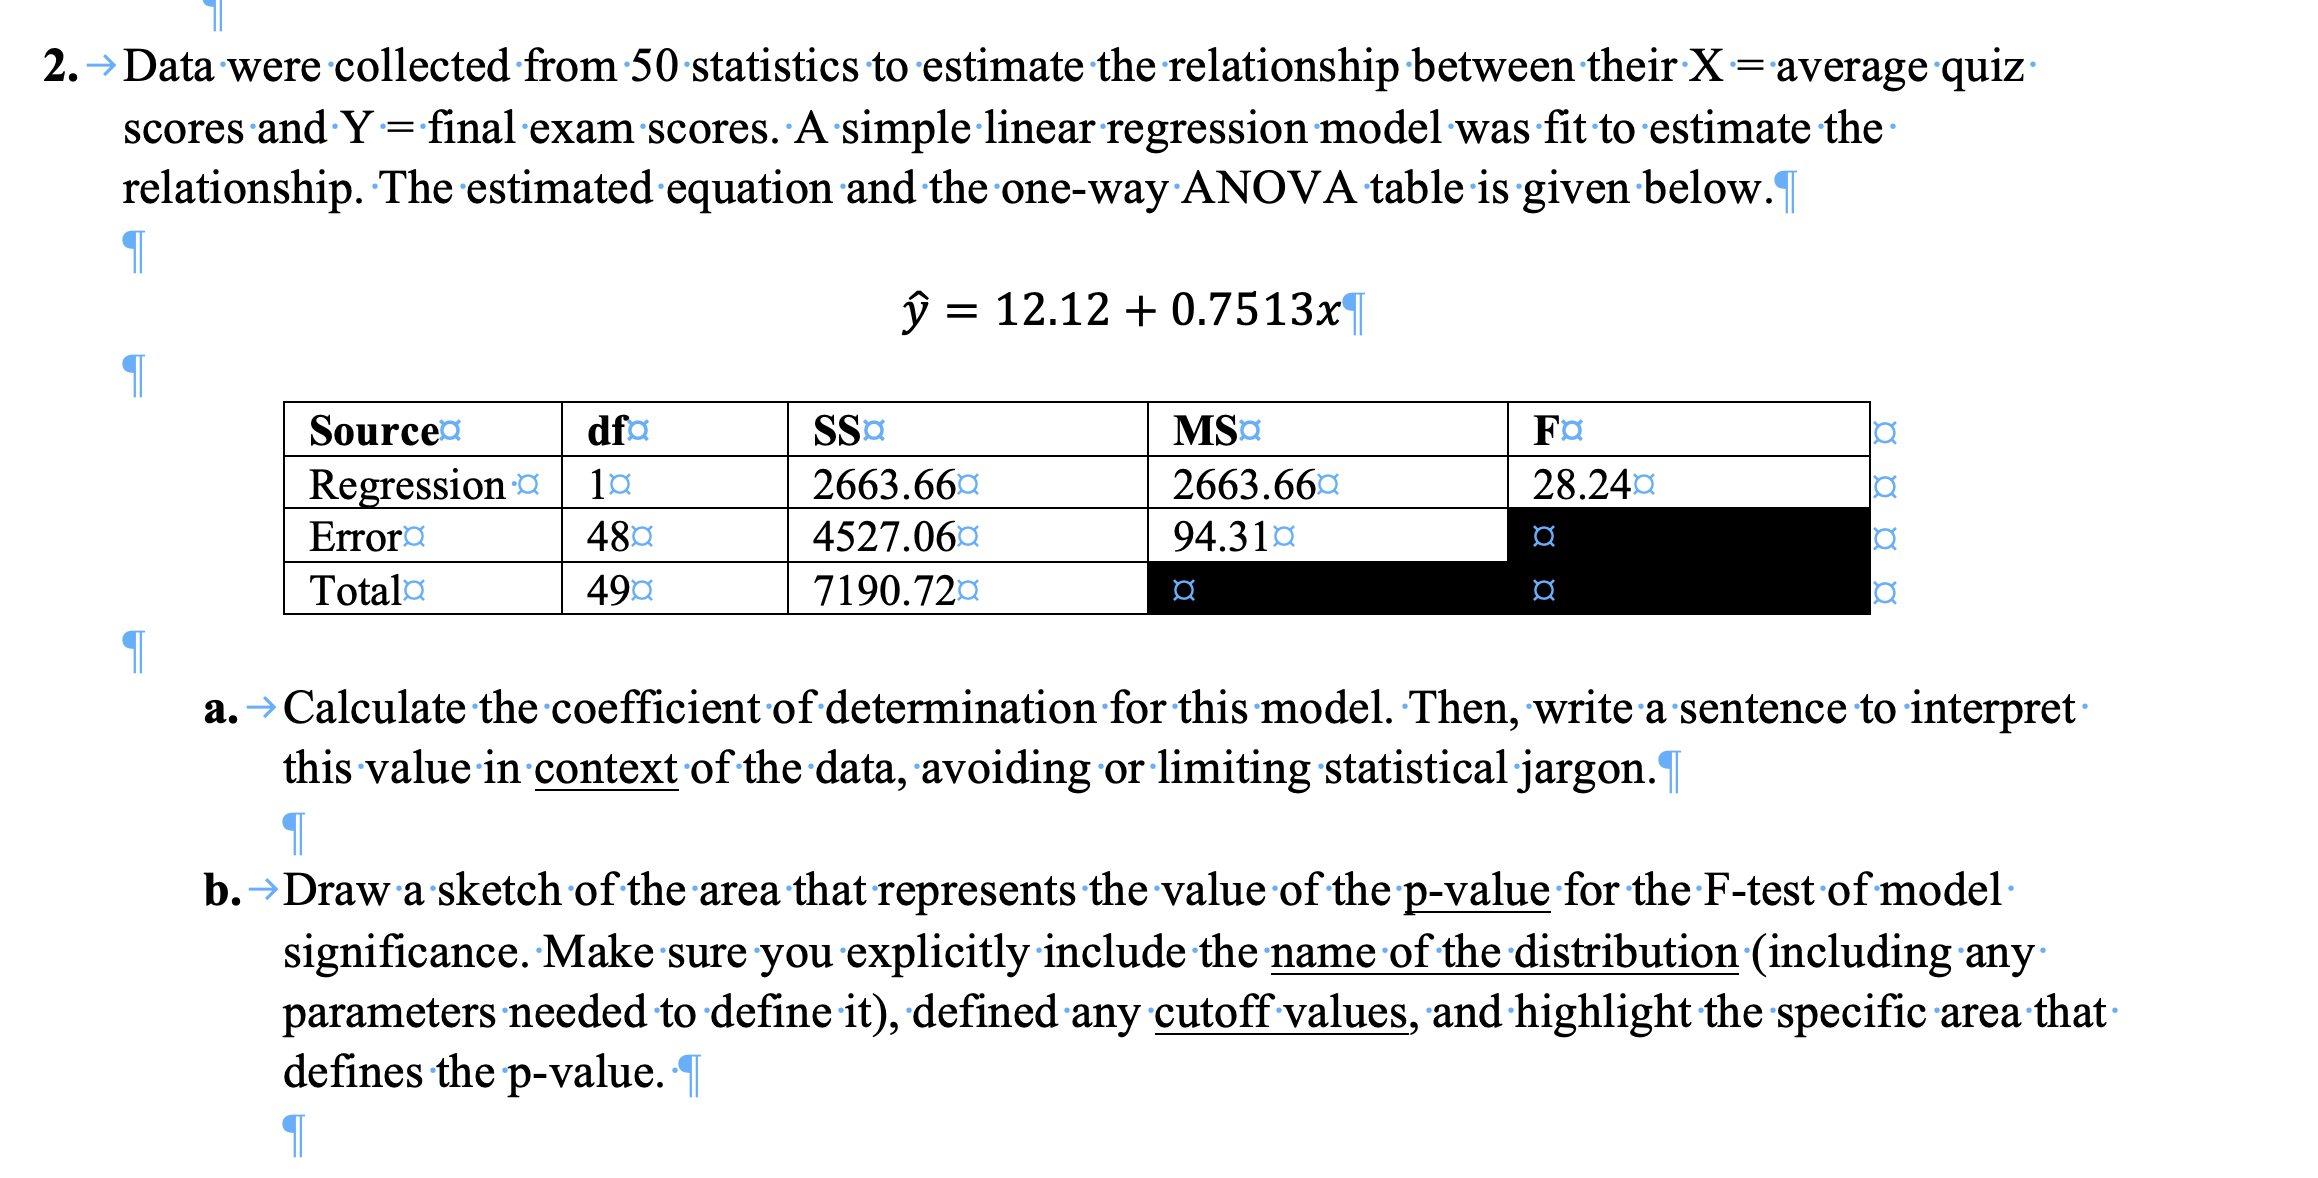
2. - Data were collected from 50 statistics to estimate the relationship between their X = average quiz scores and Y = final exam scores. A simple linear regression model was fit to estimate the relationship. The estimated equation and the one-way ANOVA table is given below.I y = 12.12 + 0.7513x Sourcea dfa SSa MSa Fa a Regression a 2663.660 2663.660 28.240 Errora 480 4527.060 94.310 a Totala 490 7190.720 a a. -> Calculate the coefficient of determination for this model. Then, write a sentence to interpret this value in context of the data, avoiding or limiting statistical jargon. I b. - Draw a sketch of the area that represents the value of the p-value for the F-test of model significance. Make sure you explicitly include the name of the distribution (including any parameters needed to define it), defined any cutoff values, and highlight the specific area that defines the p-value. I T
Step by Step Solution
There are 3 Steps involved in it

Get step-by-step solutions from verified subject matter experts