

Question: Data Window Help Excel File Edit View Insert Format Tools AutoSave OFF E sv 5 Insert Draw Page Layout Formulas Data FIN 230-02 Exan Home
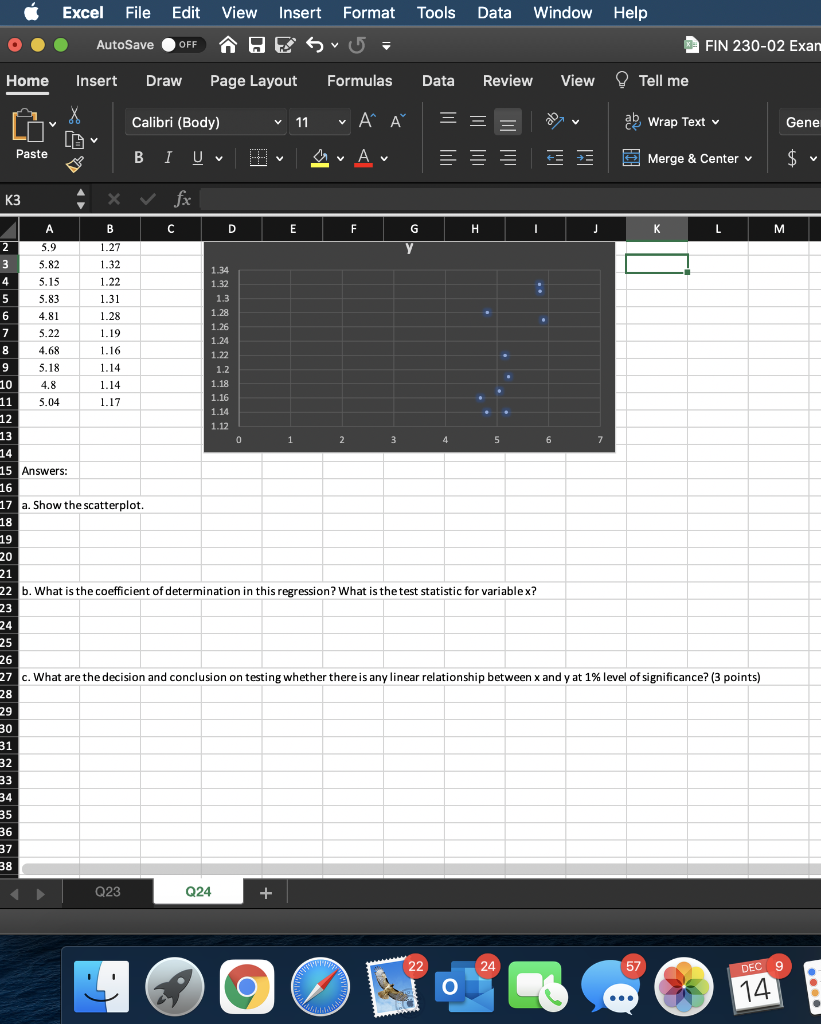
Data Window Help Excel File Edit View Insert Format Tools AutoSave OFF E sv 5 Insert Draw Page Layout Formulas Data FIN 230-02 Exan Home Review View Tell me Calibri (Body) 11 = ab Wrap Text Gene Paste BI U v V Av E Merge & Center v $ K3 M 1.34 nuuuuu 4 A B D E F H J L 2 5.9 1.27 3 5.82 1.32 4 5.15 1.22 1.32 5 5.83 1.31 1.3 6 4.81 1.28 1.28 7 5.22 1.26 1.19 1.24 8 4.68 1.16 1.22 9 5.18 1.14 1.2 10 4.8 1.14 1.18 11 5.04 1.17 1.16 1.14 12 1.12 13 0 1 2 3 5 6 7 14 15 Answers: 16 17 a. Show the scatterplot. 18 19 20 21 22 b. What is the coefficient of determination in this regression? What is the test statistic for variablex? 23 24 25 26 27 c. What are the decision and conclusion on testing whether there is any linear relationship between x and y at 1% level of significance? (3 points) 28 29 30 31 32 33 34 35 36 37 38 Q23 Q24 + 22 24 57 DEC 9 14 Data Window Help Excel File Edit View Insert Format Tools AutoSave OFF E sv 5 Insert Draw Page Layout Formulas Data FIN 230-02 Exan Home Review View Tell me Calibri (Body) 11 = ab Wrap Text Gene Paste BI U v V Av E Merge & Center v $ K3 M 1.34 nuuuuu 4 A B D E F H J L 2 5.9 1.27 3 5.82 1.32 4 5.15 1.22 1.32 5 5.83 1.31 1.3 6 4.81 1.28 1.28 7 5.22 1.26 1.19 1.24 8 4.68 1.16 1.22 9 5.18 1.14 1.2 10 4.8 1.14 1.18 11 5.04 1.17 1.16 1.14 12 1.12 13 0 1 2 3 5 6 7 14 15 Answers: 16 17 a. Show the scatterplot. 18 19 20 21 22 b. What is the coefficient of determination in this regression? What is the test statistic for variablex? 23 24 25 26 27 c. What are the decision and conclusion on testing whether there is any linear relationship between x and y at 1% level of significance? (3 points) 28 29 30 31 32 33 34 35 36 37 38 Q23 Q24 + 22 24 57 DEC 9 14
Step by Step Solution
There are 3 Steps involved in it

Get step-by-step solutions from verified subject matter experts