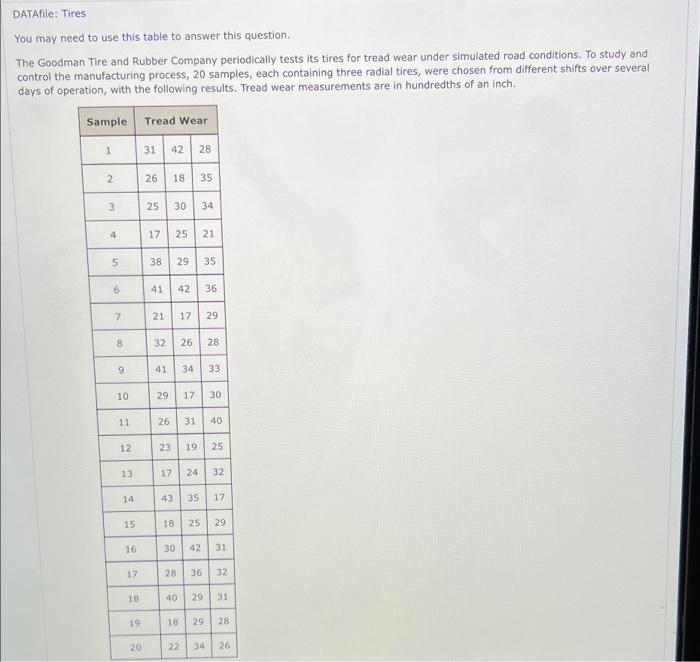
Question: DATAfile: Tires You may need to use this table to answer this question.. The Goodman Tire and Rubber Company periodically tests its tires for tread

DATAfile: Tires You may need to use this table to
DATAfile: Tires You may need to use this table to answer this question.. The Goodman Tire and Rubber Company periodically tests its tires for tread wear under simulated road conditions. To study and control the manufacturing process, 20 samples, each containing three radial tires, were chosen from different shifts over several days of operation, with the following results. Tread wear measurements are in hundredths of an inch. Sample 1 2 4 5 6 7 8 9 10 11 12 13 14 15 16 17 18 19 20 Tread Wear 31 42 28 26 18 35 25 30 34 17 25 21 38 29 35 41 42 36 21 17 32 41 26 29 28 34 33 29 17 30 26 31 40 23 19 25 17 24 32 43 35 17 18 25 29 30 42 31 28 36 32 40 29 31 18 29 28 22 34 26 Assuming that these data were collected when the manufacturing process was believed to be operating in control, develop the R chart. Compute the upper and lower control limits for the R chart. (Round your answers to two decimal places.) UCL = LCL = Construct the R chart.. 35+ 30 25 20 15: 10 0 Sample Range d 5 of 35 30- 25 20 15 10- 5 UCL LCL 246 8 10 12 14 16 18 20 Sample Number UCL LCL 2 4 6 8 10 12 14 16 18 20 Sample Number Sample Range 35 30 25 20- 15- 10- 5- 0 35 30 25 20 15 10 5- 0- 24 UCL 246 8 10 12 14 16 18 20 Sample Number LCL Sample Number UCL LCL 8 10 12 14 16 18 20 Assuming that these data were collected when the manufacturing process was believed to be operating in control, develop the x chart. Compute the upper and lower control limits for the x chart. (Round your answers to two decimal places.) UCL = LCL = Construct the x chart. 50+ 45 40 35 Sample Mean X 30- 25- 20 15 Sample Mean X ww 50 45 40 35 30- 25 20 15 2 4 6 24 Sample Number AA UCL 8 10 12 14 16 18 20 LCL UCL LCL 6 8 10 12 14 16 18 20 Sample Number Sample Mean x Sample Mean X 50 45 40 35 30 20 15 50- 45 40 35 30 25 20- 15 2 4 UCL LCL 6 8 10 12 14 16 18 20 Sample Number UCL LCL 2 4 6 8 10 12 14 16 18 20 Sample Number

Step by Step Solution

There are 3 Steps involved in it

1 Expert Approved Answer
Step: 1 Unlock blur-text-image
Question Has Been Solved by an Expert!

Get step-by-step solutions from verified subject matter experts

Step: 2 Unlock
Step: 3 Unlock

Students Have Also Explored These Related General Management Questions!