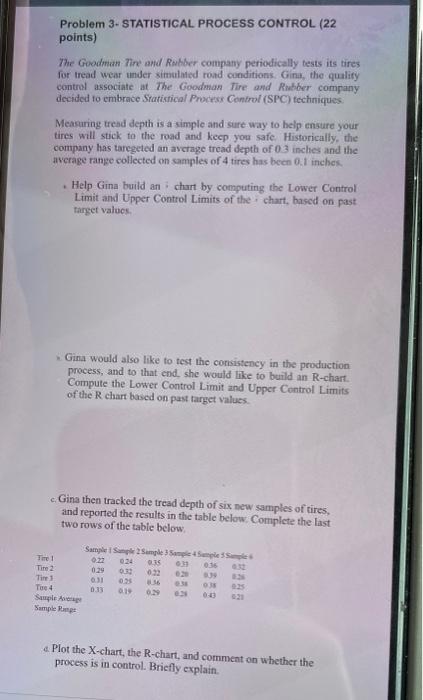
Question: Problem 3-STATISTICAL PROCESS CONTROL (22 points) The Goodman Tire and Rubber company periodically tests its tires for tread wear under simulated road conditions. Gina, the

Problem 3-STATISTICAL PROCESS CONTROL (22 points)
Problem 3-STATISTICAL PROCESS CONTROL (22 points) The Goodman Tire and Rubber company periodically tests its tires for tread wear under simulated road conditions. Gina, the quality control associate at The Goodman Tire and Rubber company decided to embrace Statistical Process Control (SPC) techniques Measuring tread depth is a simple and sure way to help ensure your tires will stick to the road and keep you safe. Historically, the company has taregeted an average tread depth of 0.3 inches and the average range collected on samples of 4 tires has been 0.1 inches Help Gina build an chart by computing the Lower Control Limit and Upper Control Limits of the chart, based on past Target values, Gina would also like to test the consistency in the production process, and to that end, she would like to build an R-chart. Compute the Lower Control Limit and Upper Control Limits of the R chart based on past target values. Gina then tracked the tread depth of six new samples of tires, and reported the results in the table below. Complete the last two rows of the table below, 012 Sample sample sample 35mm Time 1 024 015 016 Tine 2 0.29 03 30 Tine 0.31 0.95 3 3 Tue 4 0.13 019 ON 0-13 Sample Samples Plot the X-chart, the R-chart, and comment on whether the process is in control. Briefly explain

Step by Step Solution

There are 3 Steps involved in it

1 Expert Approved Answer
Step: 1 Unlock blur-text-image
Question Has Been Solved by an Expert!

Get step-by-step solutions from verified subject matter experts

Step: 2 Unlock
Step: 3 Unlock

Students Have Also Explored These Related General Management Questions!