

Question: Dataset: https://drive.google.com/drive/folders/1sI6xYM4sSWxdfEL5yN7OpNuqVVROaZXj?usp=sharing Use the Store_Demand_Final.csv le. You will be using simple exponential smoothing to forecast demand. The dataset has two columns Date and total_demand with
Dataset: https://drive.google.com/drive/folders/1sI6xYM4sSWxdfEL5yN7OpNuqVVROaZXj?usp=sharing
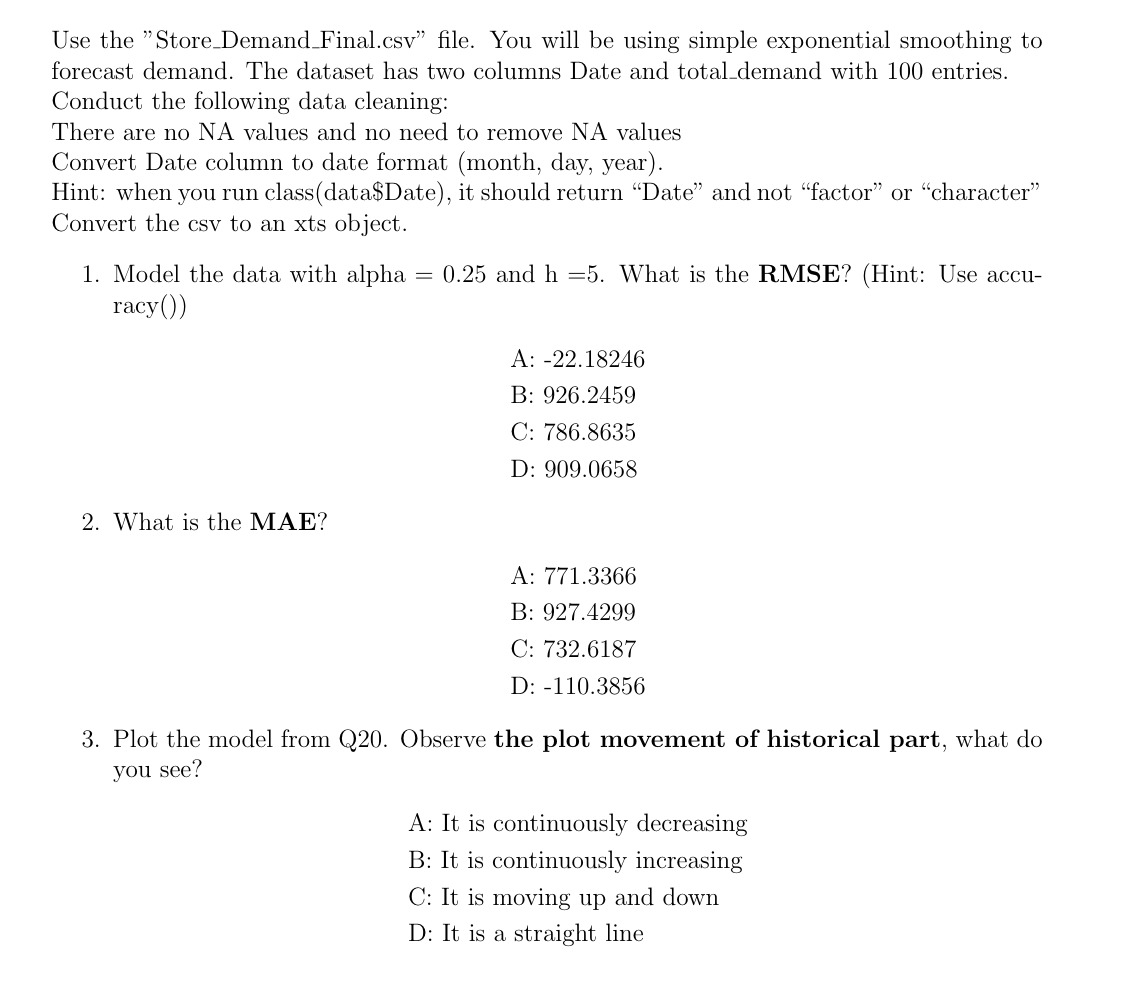
Use the \"Store_Demand_Final.csv\" le. You will be using simple exponential smoothing to forecast demand. The dataset has two columns Date and total_demand with 100 entries. Conduct the following data cleaning: There are no NA values and no need to remove NA values Convert Date column to date format (month, day, year). Hint: when you run class{data$Date), it should return \"Date\" and not \"factor\" or \"character\" Convert the csv to an xts object. 1. Model the data with alpha 2 0.25 and h =5. What is the RMSE? (Hint: Use accu- raCYO) A B C. D 2. What is the MAE? A B C D: : -22.18246 : 926.2459 ' 786.8635 : 909.0658 : 771.3366 : 927.4299 : 732.6187 -110.3856 3. Plot the model from Q20. Observe the plot movement of historical part, what do you see? A: It is continuously decreasing B: It is continuously increasing C: It is moving up and down D: It is a straight line
Step by Step Solution
There are 3 Steps involved in it

Get step-by-step solutions from verified subject matter experts