

Question: dataset : https://drive.google.com/uc?export=download&id=1iCti5uxMveZIu7ENCjAcGszFFCa3fqnn . 1. Plotting Question 1. Plot a line chart for Petal_Length and the Petal_Width on the y axis and x-axis is the
 dataset : https://drive.google.com/uc?export=download&id=1iCti5uxMveZIu7ENCjAcGszFFCa3fqnn
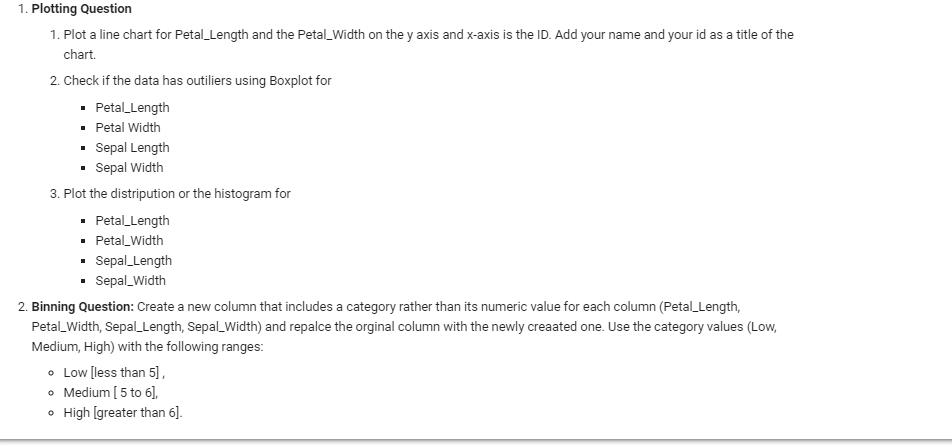
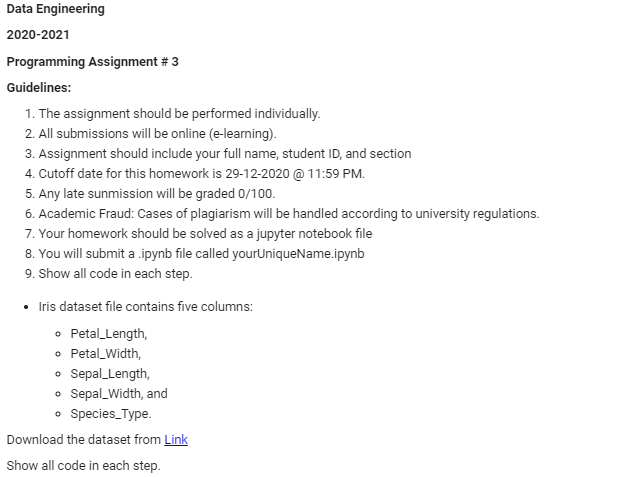
. 1. Plotting Question 1. Plot a line chart for Petal_Length and the Petal_Width on the y axis and x-axis is the ID. Add your name and your id as a title of the chart 2. Check if the data has outiliers using Boxplot for Petal_Length Petal Width Sepal Length Sepal Width 3. Plot the distripution or the histogram for Petal_Length Petal_Width Sepal_Length Sepal_Width 2. Binning Question: Create a new column that includes a category rather than its numeric value for each column (Petal_Length, Petal_Width, Sepal_Length, Sepal_Width) and repalce the orginal column with the newly created one. Use the category values (Low, Medium, High) with the following ranges: Low less than 5] Medium [ 5 to 6). High [greater than 6]. Data Engineering 2020-2021 Programming Assignment #3 Guidelines: 1. The assignment should be performed individually. 2. All submissions will be online (e-learning). 3. Assignment should include your full name, student ID, and section 4. Cutoff date for this homework is 29-12-2020 @ 11:59 PM. 5. Any late sunmission will be graded 0/100 6. Academic Fraud: Cases of plagiarism will be handled according to university regulations. 7. Your homework should be solved as a jupyter notebook file 8. You will submit a .ipynb file called yourUniqueName.ipynb 9. Show all code in each step. Iris dataset file contains five columns: Petal_Length, Petal_Width Sepal_Length, Sepal_Width, and Species_Type. Download the dataset from Link Show all code in each step. . 1. Plotting Question 1. Plot a line chart for Petal_Length and the Petal_Width on the y axis and x-axis is the ID. Add your name and your id as a title of the chart 2. Check if the data has outiliers using Boxplot for Petal_Length Petal Width Sepal Length Sepal Width 3. Plot the distripution or the histogram for Petal_Length Petal_Width Sepal_Length Sepal_Width 2. Binning Question: Create a new column that includes a category rather than its numeric value for each column (Petal_Length, Petal_Width, Sepal_Length, Sepal_Width) and repalce the orginal column with the newly created one. Use the category values (Low, Medium, High) with the following ranges: Low less than 5] Medium [ 5 to 6). High [greater than 6]. Data Engineering 2020-2021 Programming Assignment #3 Guidelines: 1. The assignment should be performed individually. 2. All submissions will be online (e-learning). 3. Assignment should include your full name, student ID, and section 4. Cutoff date for this homework is 29-12-2020 @ 11:59 PM. 5. Any late sunmission will be graded 0/100 6. Academic Fraud: Cases of plagiarism will be handled according to university regulations. 7. Your homework should be solved as a jupyter notebook file 8. You will submit a .ipynb file called yourUniqueName.ipynb 9. Show all code in each step. Iris dataset file contains five columns: Petal_Length, Petal_Width Sepal_Length, Sepal_Width, and Species_Type. Download the dataset from Link Show all code in each step
Step by Step Solution
There are 3 Steps involved in it

Get step-by-step solutions from verified subject matter experts