

Question: Date: Name: Class: Complete: O 1 The graph below shows the temperature of water in a home's water heater over a 5-hour period. Use the
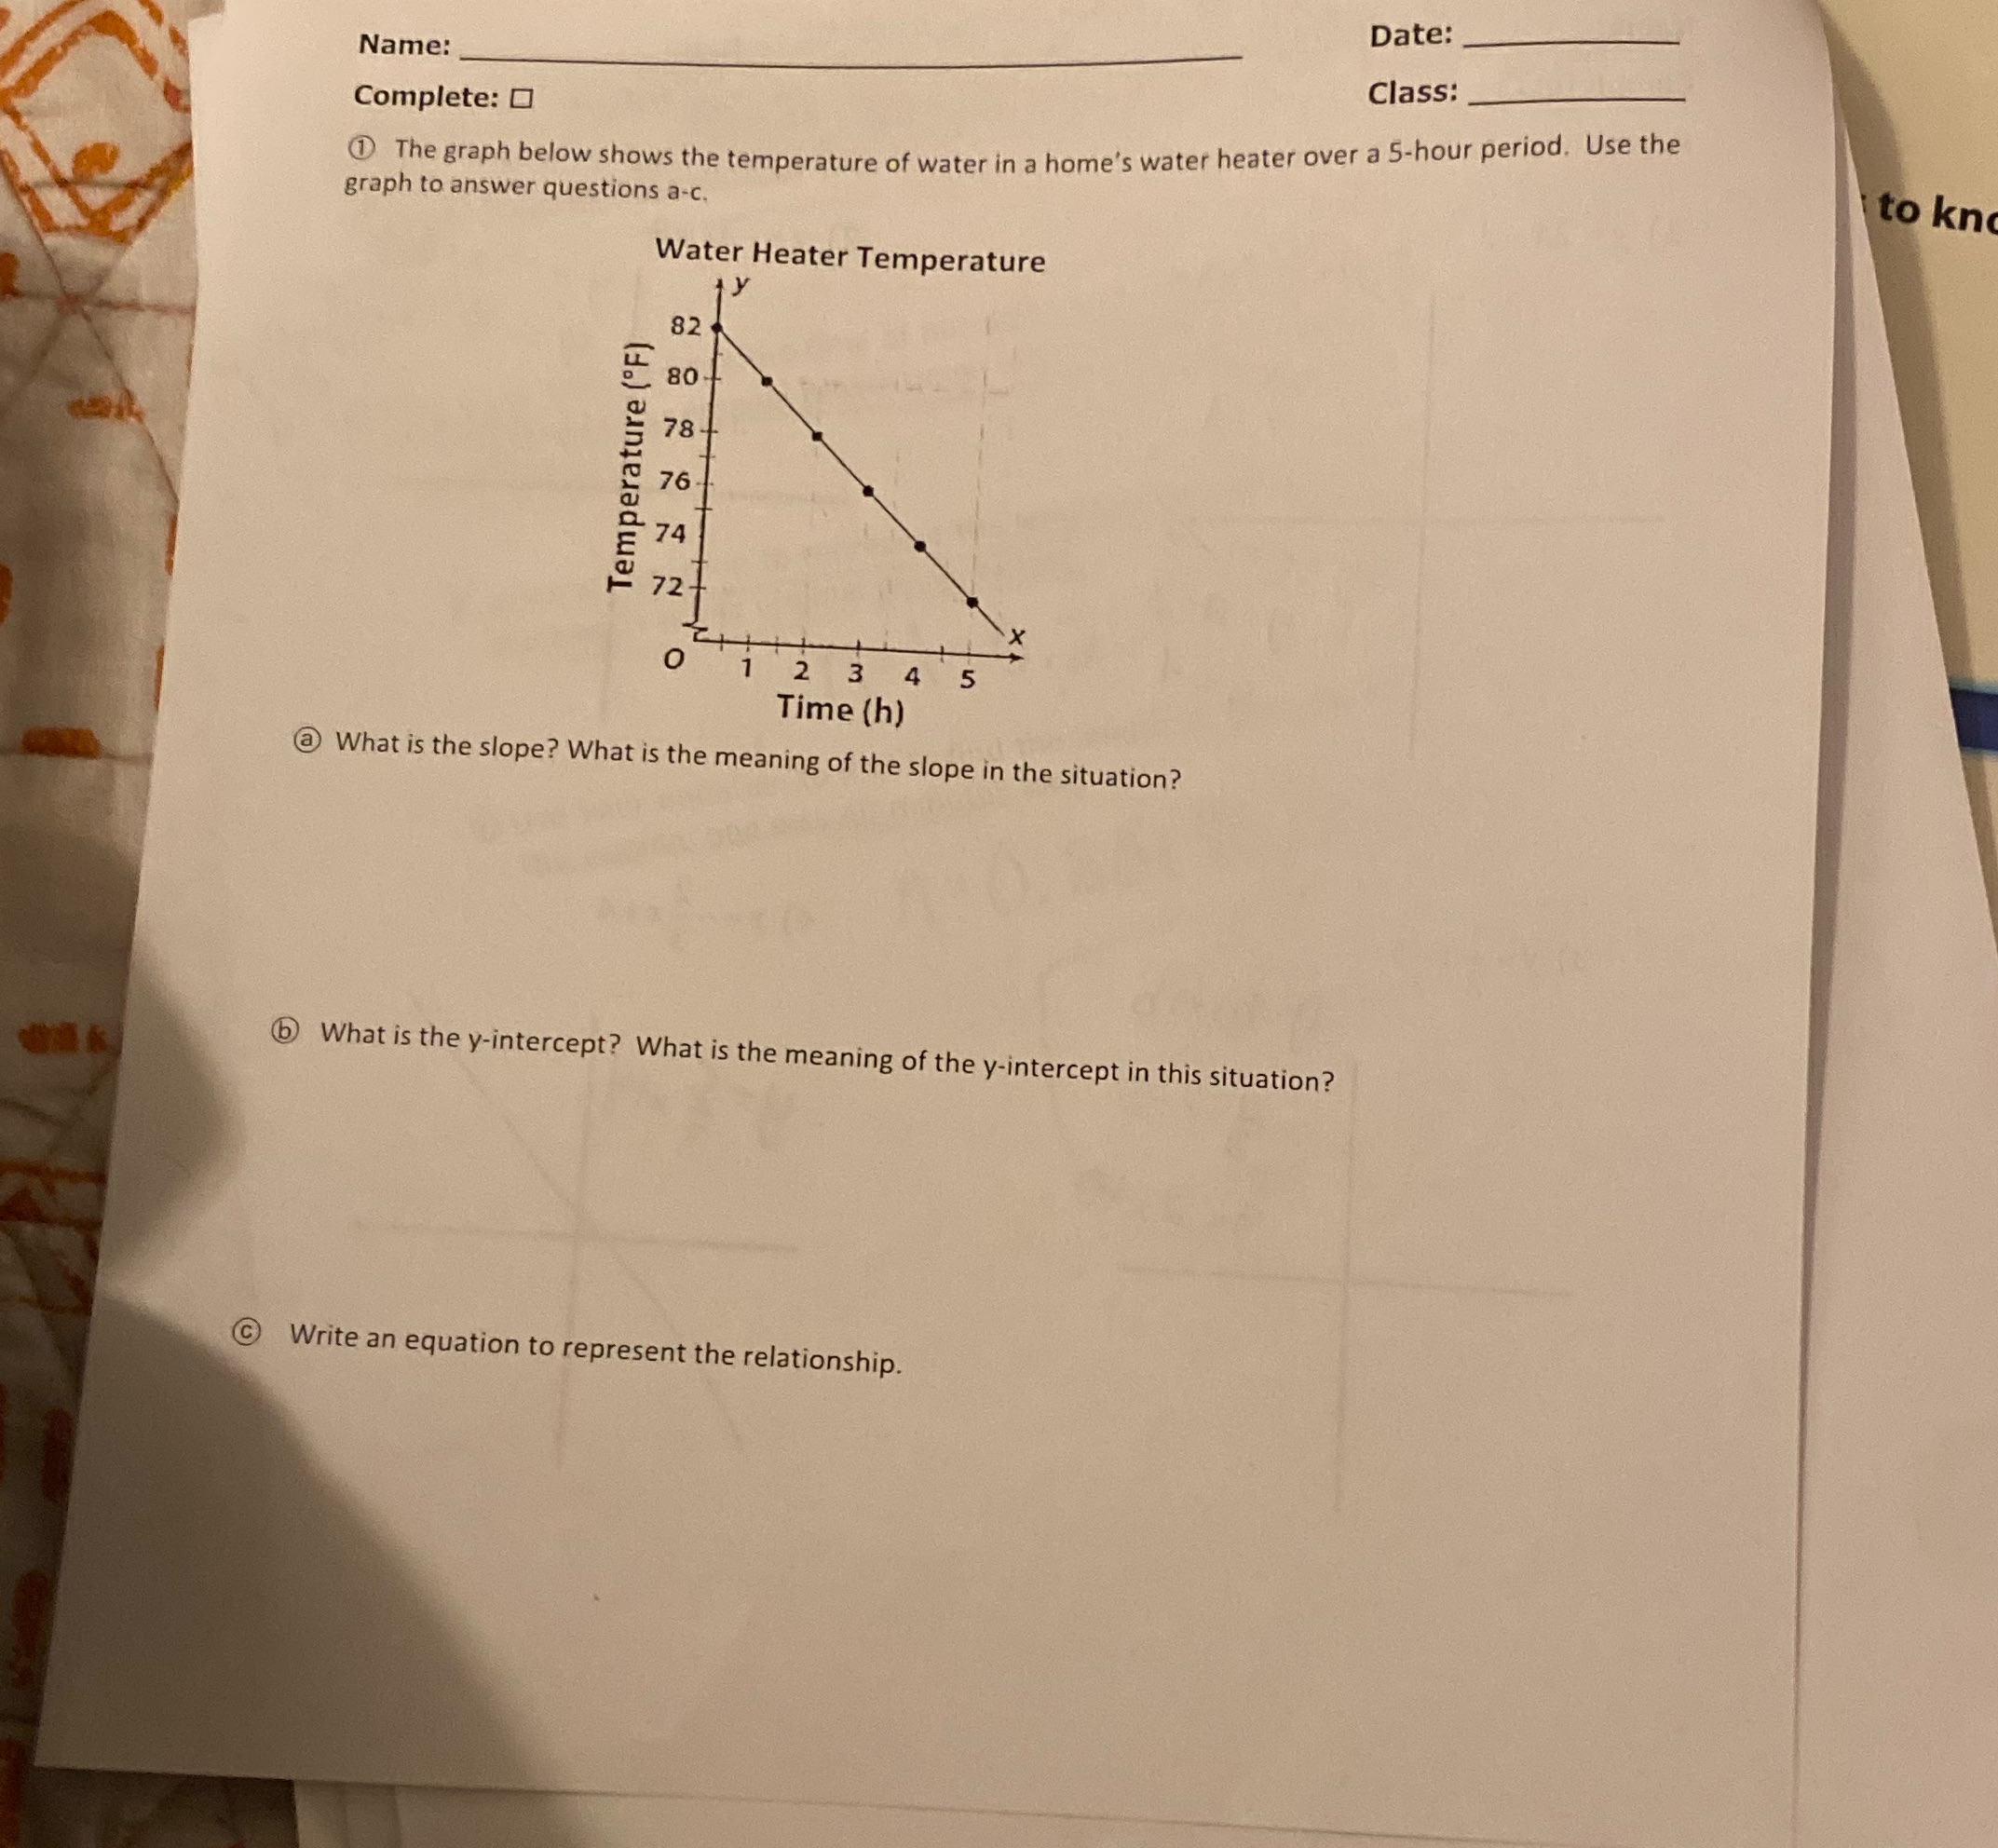
Date: Name: Class: Complete: O 1 The graph below shows the temperature of water in a home's water heater over a 5-hour period. Use the to kn graph to answer questions a-c. Water Heater Temperature 82 80 78 Temperature ('F) 76 74 o 2 4 5 Time (h) @ What is the slope? What is the meaning of the slope in the situation? What is the y-intercept? What is the meaning of the y-intercept in this situation? Write an equation to represent the relationship
Step by Step Solution
There are 3 Steps involved in it
1 Expert Approved Answer
Step: 1 Unlock

Question Has Been Solved by an Expert!
Get step-by-step solutions from verified subject matter experts
Step: 2 Unlock
Step: 3 Unlock