

Question: David's Landscaping has collected data on home values (in thousands of $) and expenditures (in thousands of $) on landscaping with the hope of developing
David's Landscaping has collected data on home values (in thousands of $) and expenditures (in thousands of $) on landscaping with the hope of developing a predictive model to help marketing to potential new clients. Data for14households may be found in the fileLandscape. Click on the datafile logo to reference the data.
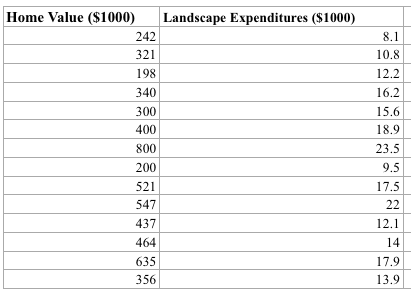
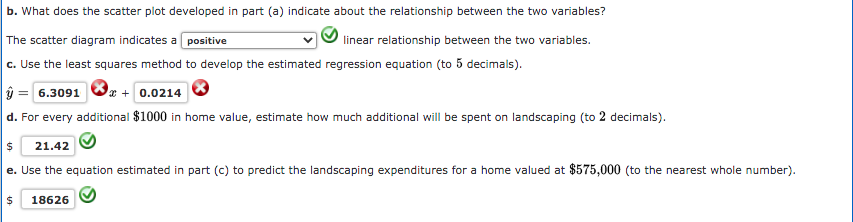
Home Value ($1000) Landscape Expenditures ($1000) 242 8.1 321 10.8 198 12.2 340 16.2 300 15.6 400 18.9 800 23.5 200 9.5 521 17.5 547 22 437 12.1 464 14 635 17.9 356 13.9b. What does the scatter plot developed in part (a) indicate about the relationship between the two variables? The scatter diagram indicates a positive linear relationship between the two variables. c. Use the least squares method to develop the estimated regression equation (to 5 decimals). = 6.3091 0.0214 d. For every additional $1000 in home value, estimate how much additional will be spent on landscaping (to 2 decimals). $ 21.42 e. Use the equation estimated in part (c) to predict the landscaping expenditures for a home valued at $575,000 (to the nearest whole number). $ 18626
Step by Step Solution
There are 3 Steps involved in it

Get step-by-step solutions from verified subject matter experts