

Question: Day 1 2 Errors (Defects) 14 7 3 8 4 16 5 38 6 15 7 8 19 9 11 10 Silk Sonic Pizza shop
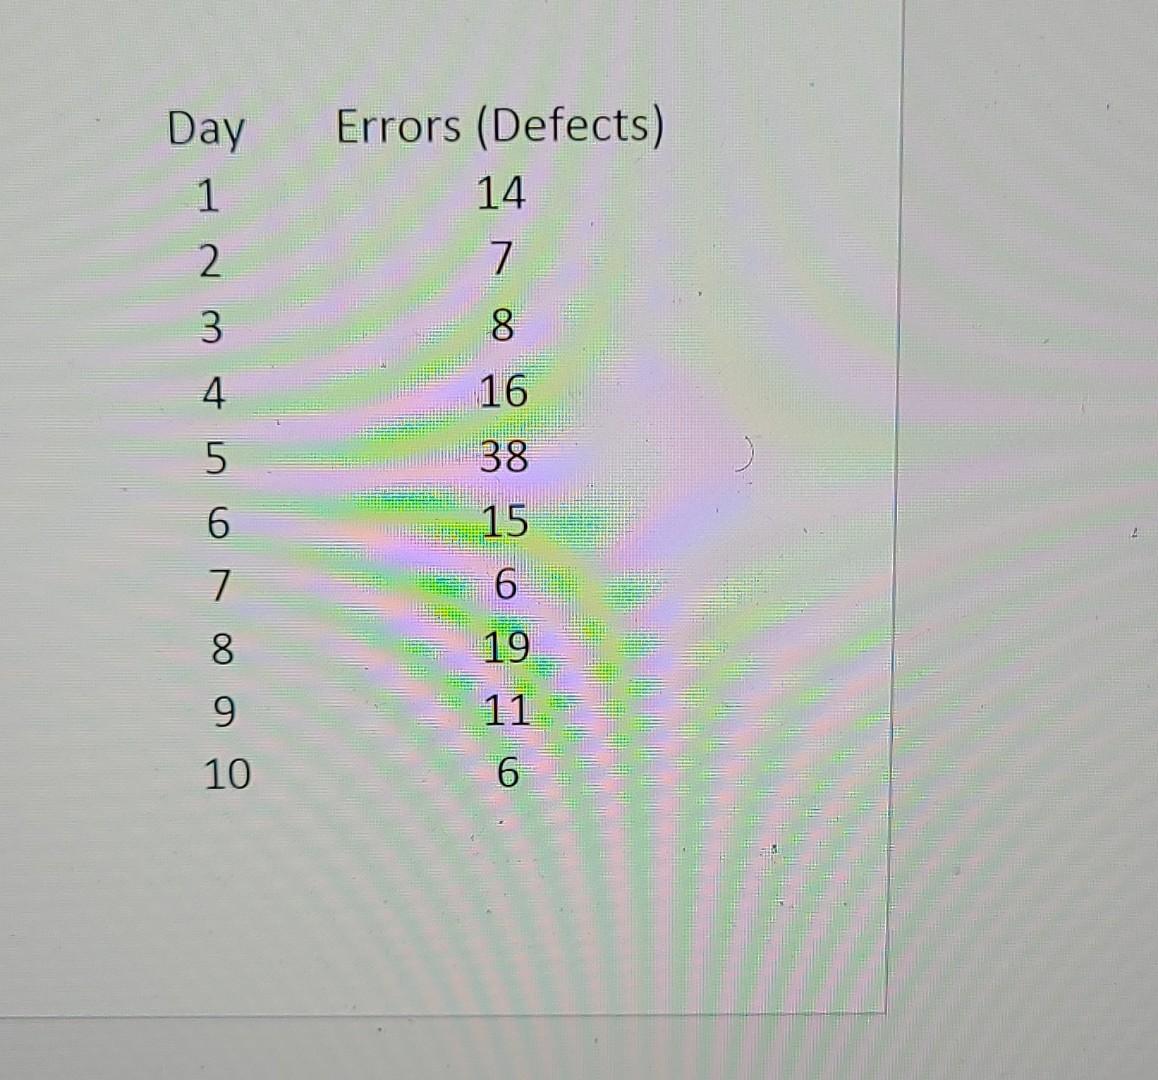
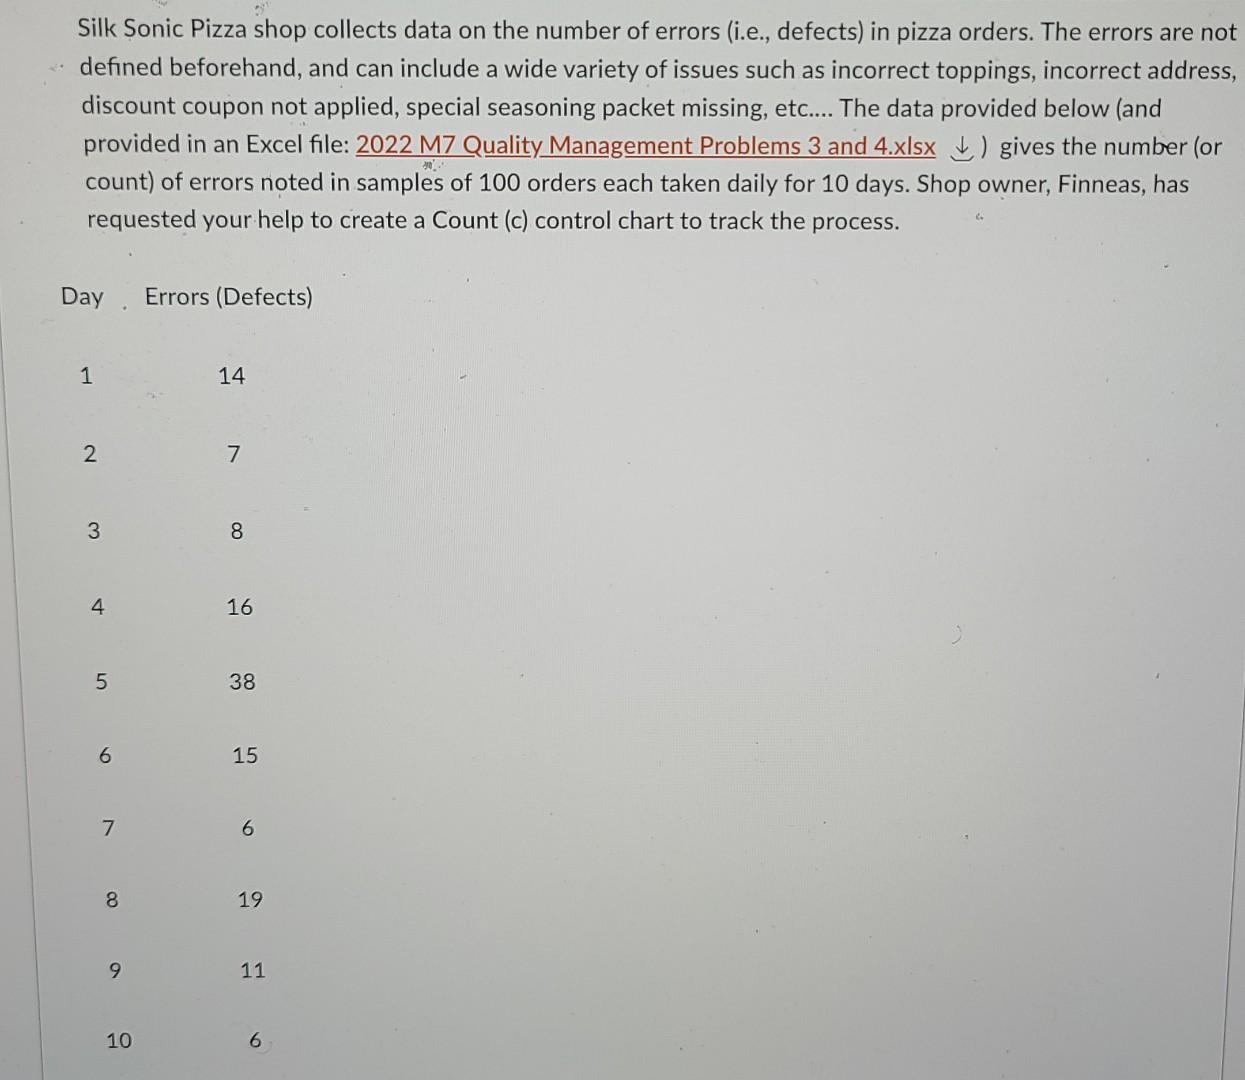

Day 1 2 Errors (Defects) 14 7 3 8 4 16 5 38 6 15 7 8 19 9 11 10 Silk Sonic Pizza shop collects data on the number of errors (i.e., defects) in pizza orders. The errors are not defined beforehand, and can include a wide variety of issues such as incorrect toppings, incorrect address, discount coupon not applied, special seasoning packet missing, etc... The data provided below (and provided in an Excel file: 2022 M7 Quality Management Problems 3 and 4.xlsx) gives the number (or count) of errors noted in samples of 100 orders each taken daily for 10 days. Shop owner, Finneas, has requested your help to create a Count (c) control chart to track the process. Day Errors (Defects) 1 14 2 7 3 00 8 4 16 5 38 6 15 7 6 8 8 19 9 11 10 6 Please help Finneas by calculating and reporting, the value for the Center Line (rounded to the nearest whole number) of the Count (c) control chart
Step by Step Solution
There are 3 Steps involved in it
1 Expert Approved Answer
Step: 1 Unlock

Question Has Been Solved by an Expert!
Get step-by-step solutions from verified subject matter experts
Step: 2 Unlock
Step: 3 Unlock