

Question: Decline curve analysis (DCA) is a graphical procedure used for analyzing declining production rates and forecasting future performance of oil and gas wells. Production rates
Decline curve analysis (DCA) is a graphical procedure used for analyzing declining production rates and forecasting future performance of oil and gas wells. Production rates decline as a function of time owing to loss of reservoir pressure and changing relative volumes of the produced fluids. Three types of declines are observed:
- Exponential
- Hyperbolic (most applicable to horizontal fracture stimulated well)
- Harmonic
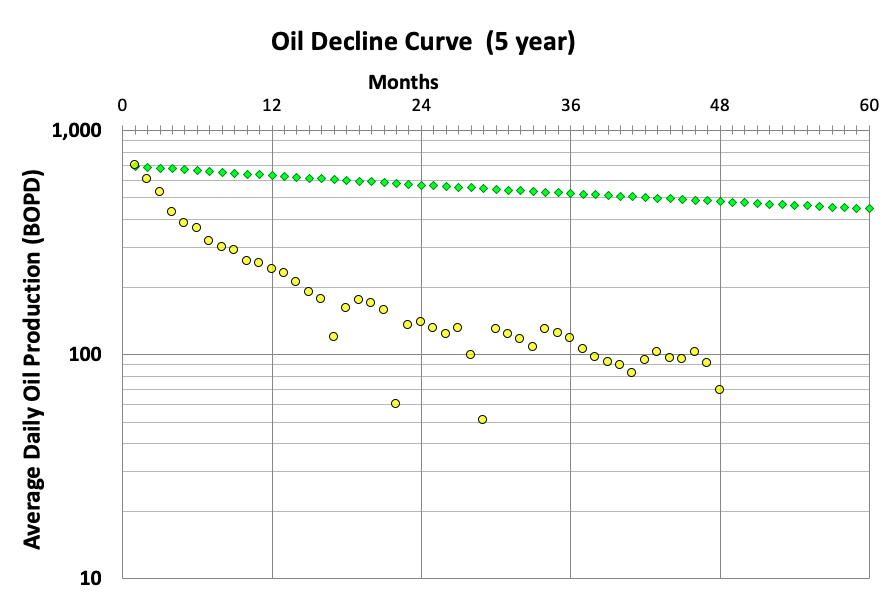
In this assignment you will use Arps hyperbolic decline. You are given 48 months of oil production from the Slong-1 (column A in Oil Forecast sheet) from which you will history match the first 48 months of production and then forecast future production out 40 years (480 months). You are given the 5-year NYMEX strip price for light oil, well cost, Net Revenue Interest, and Operating Expense from which you will calculate Discounted Cash Flow, Return on Investment and Net Present Value. From these outputs you are asked to make a recommendation regarding participation in an upcoming well several miles away.
The Arps equation has 3 variables that dictate the shape of the hyperbolic decline curve. You will need to fiddle with these variables until you get a fit that you are comfortable with in terms of make a recommendation on participation.
- Qi is the initial production in barrels oil per day
- Di is the annual decline rate as a percentage
- n is termed the b factor which has a strong influence on the extended shape of long-term production and hence forecast EUR.
Also included is a sheet with several different parameters plotted to help with your analysis.
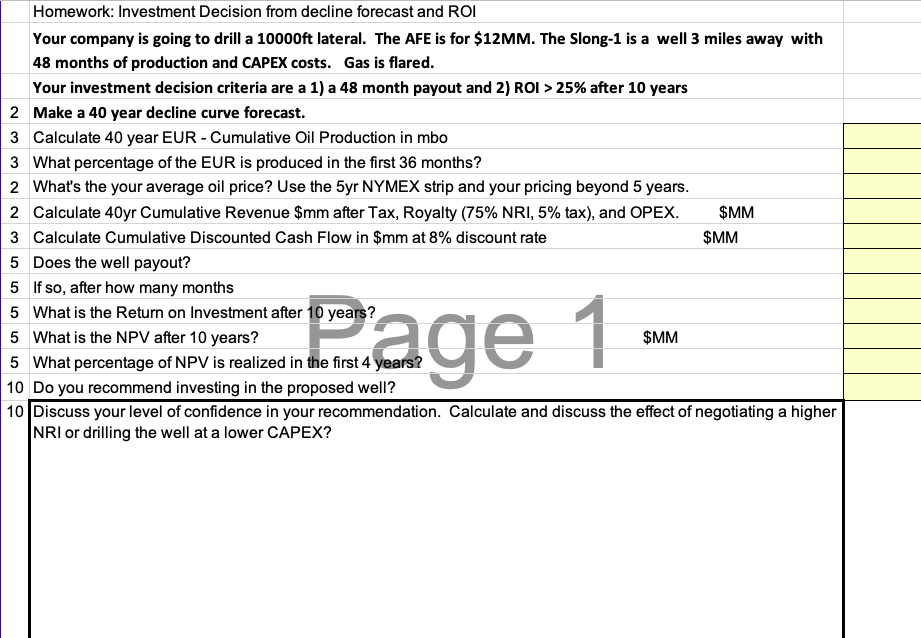
Homework: Investment Decision from decline forecast and ROI Your company is going to drill a 10000ft lateral. The AFE is for $12MM. The Slong-1 is a well 3 miles away with 48 months of production and CAPEX costs. Gas is flared. Your investment decision criteria are a 1) a 48 month payout and 2) ROI > 25% after 10 years 2 Make a 40 year decline curve forecast. 3 Calculate 40 year EUR - Cumulative Oil Production in mbo 3 What percentage of the EUR is produced in the first 36 months? What's the your average oil price? Use the 5yr NYMEX strip and your pricing beyond 5 years. 2 Calculate 40yr Cumulative Revenue $mm after Tax, Royalty (75% NRI, 5% tax), and OPEX. 3 Calculate Cumulative Discounted Cash Flow in $mm at 8% discount rate 5 Does the well payout? 5 If so, after how many months 5 What is the Return on Investment after 10 years? 5 What is the NPV after 10 years? 5 What percentage of NPV is realized in the first 4 yea 10 Do you recommend investing in the proposed well? 2 $MM $MM Rage 1 $MM 10 Discuss your level of confidence in your recommendation. Calculate and discuss the effect of negotiating a higher NRI or drilling the well at a lower CAPEX? Oil Decline Curve (5 year) Months 12 24 36 48 60 0 1,000 ooo Oo 100 10 Homework: Investment Decision from decline forecast and ROI Your company is going to drill a 10000ft lateral. The AFE is for $12MM. The Slong-1 is a well 3 miles away with 48 months of production and CAPEX costs. Gas is flared. Your investment decision criteria are a 1) a 48 month payout and 2) ROI > 25% after 10 years 2 Make a 40 year decline curve forecast. 3 Calculate 40 year EUR - Cumulative Oil Production in mbo 3 What percentage of the EUR is produced in the first 36 months? What's the your average oil price? Use the 5yr NYMEX strip and your pricing beyond 5 years. 2 Calculate 40yr Cumulative Revenue $mm after Tax, Royalty (75% NRI, 5% tax), and OPEX. 3 Calculate Cumulative Discounted Cash Flow in $mm at 8% discount rate 5 Does the well payout? 5 If so, after how many months 5 What is the Return on Investment after 10 years? 5 What is the NPV after 10 years? 5 What percentage of NPV is realized in the first 4 yea 10 Do you recommend investing in the proposed well? 2 $MM $MM Rage 1 $MM 10 Discuss your level of confidence in your recommendation. Calculate and discuss the effect of negotiating a higher NRI or drilling the well at a lower CAPEX? Oil Decline Curve (5 year) Months 12 24 36 48 60 0 1,000 ooo Oo 100 10
Step by Step Solution
There are 3 Steps involved in it

Get step-by-step solutions from verified subject matter experts