

Question: Decline curve analysis (DCA) is a graphical procedure used for analyzing declining production rates and forecasting future performance of oil and gas wells. Production rates
Decline curve analysis (DCA) is a graphical procedure used for analyzing declining production rates and forecasting future performance of oil and gas wells. Production rates decline as a function of time owing to loss of reservoir pressure and changing relative volumes of the produced fluids. Three types of declines are observed:
- Exponential
- Hyperbolic (most applicable to horizontal fracture stimulated well)
- Harmonic
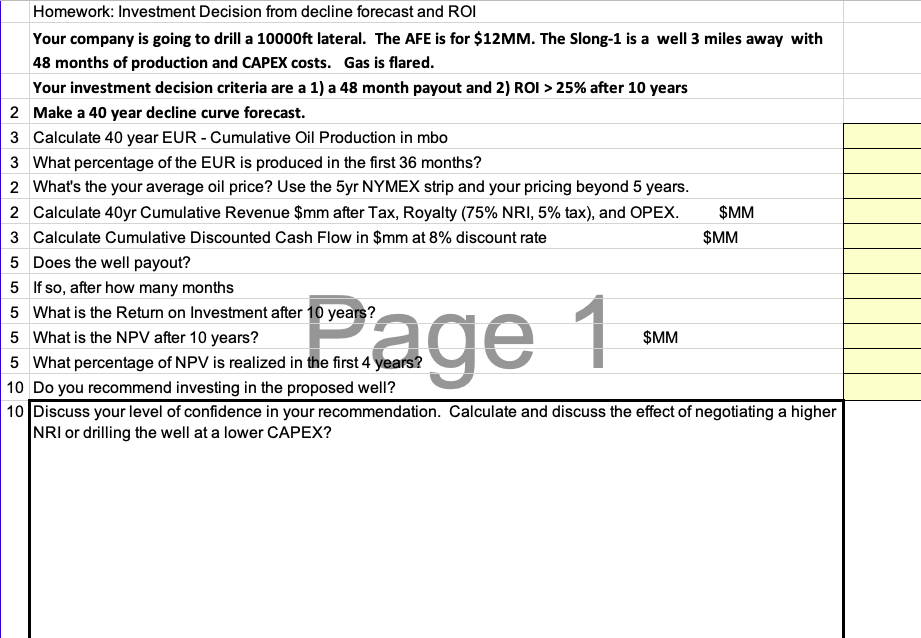
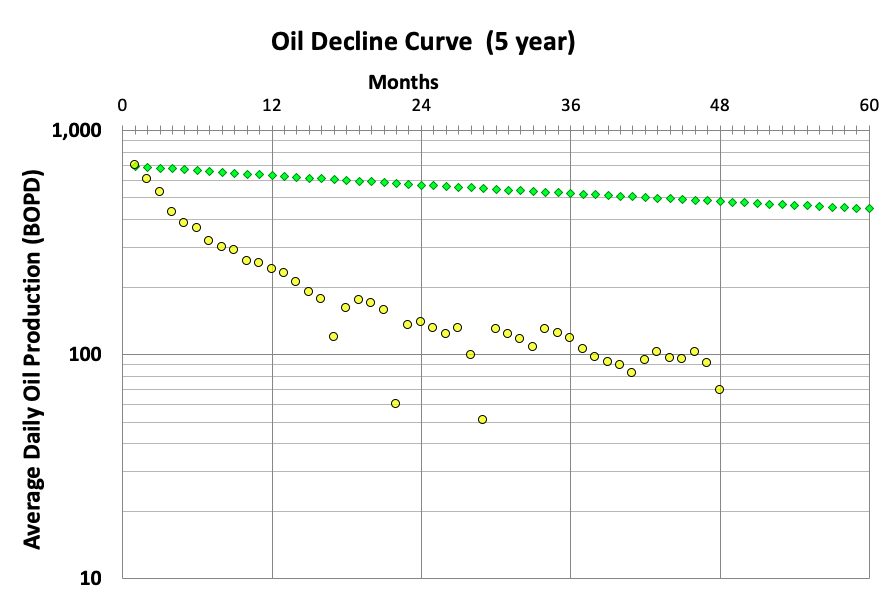
In this assignment you will use Arps hyperbolic decline. You are given 48 months of oil production from the Slong-1 (column A in Oil Forecast sheet) from which you will history match the first 48 months of production and then forecast future production out 40 years (480 months). You are given the 5-year NYMEX strip price for light oil, well cost, Net Revenue Interest, and Operating Expense from which you will calculate Discounted Cash Flow, Return on Investment and Net Present Value. From these outputs you are asked to make a recommendation regarding participation in an upcoming well several miles away.
The Arps equation has 3 variables that dictate the shape of the hyperbolic decline curve. You will need to fiddle with these variables until you get a fit that you are comfortable with in terms of make a recommendation on participation.
- Qi is the initial production in barrels oil per day
- Di is the annual decline rate as a percentage
- n is termed the b factor which has a strong influence on the extended shape of long-term production and hence forecast EUR.
Also included is a sheet with several different parameters plotted to help with your analysis.
Step by Step Solution
There are 3 Steps involved in it

Get step-by-step solutions from verified subject matter experts