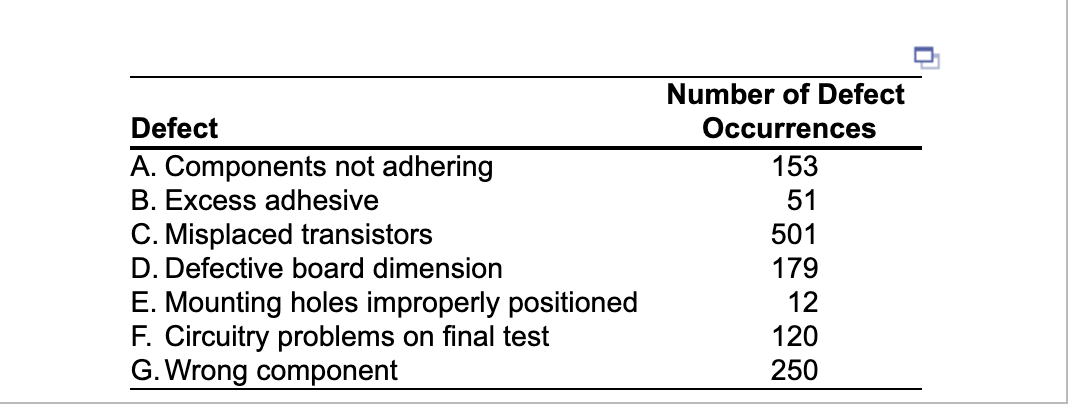
Question: Defect A. Components not adhering B. Excess adhesive C. Misplaced transistors D. Defective board dimension E. Mounting holes improperly positioned F. Circuitry problems on final

Defect A. Components not adhering B. Excess

Defect A. Components not adhering B. Excess

Defect A. Components not adhering B. Excess adhesive C. Misplaced transistors D. Defective board dimension E. Mounting holes improperly positioned F. Circuitry problems on final test G. Wrong component Number of Defect Occurrences 153 51 501 179 12 120 250 Use Pareto analysis to investigate the data collected on a printed circuit-board assembly line. Click the icon to view the data. a) Based on the data, choose the correct graph below. OA OB. 600 600 400 400 Number of defects 200- 200- 0- 0 G D A C G OC. OD 600 600 400 400 Number of defec Number of defec 200 200 CDF G D b) The Pareto chart indicates that most of the errors, %, are the result of (round your response to one decimal place). Click to select your answer(s)

Step by Step Solution

There are 3 Steps involved in it

1 Expert Approved Answer
Step: 1 Unlock blur-text-image
Question Has Been Solved by an Expert!

Get step-by-step solutions from verified subject matter experts

Step: 2 Unlock
Step: 3 Unlock

Students Have Also Explored These Related General Management Questions!