

Question: please answer b) Use Pareto analysis to investigate the data collected on a printed-circuit-board assembly line. Click the icon to view the data. More Info
please answer b) 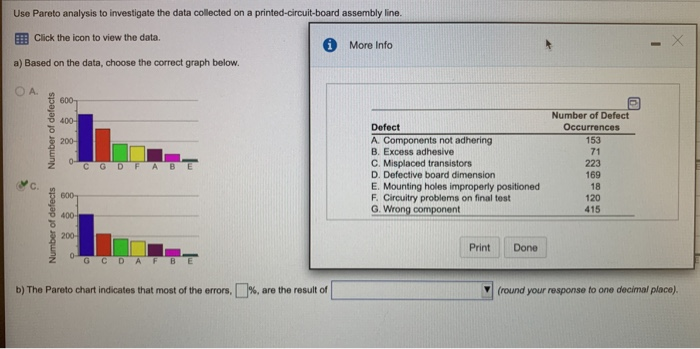
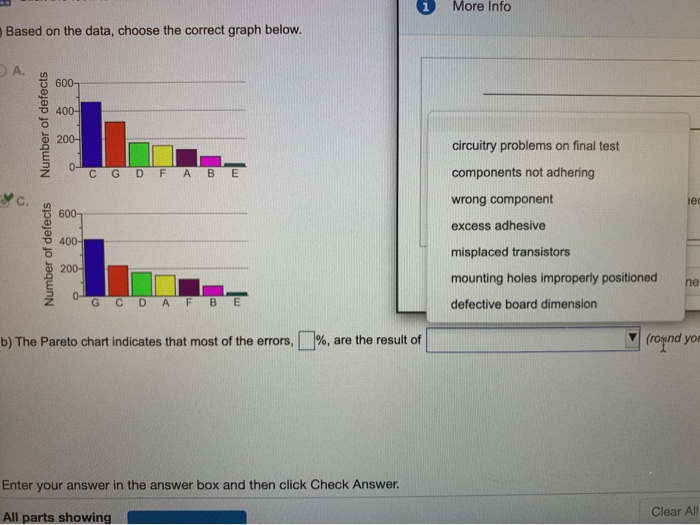
Use Pareto analysis to investigate the data collected on a printed-circuit-board assembly line. Click the icon to view the data. More Info - a) Based on the data, choose the correct graph below. OA 600 400 Number of Defect Occurrences Number of defects 200- 153 0 C G D F A B E Defect A Components not adhering B. Excess adhesive C. Misplaced transistors D. Defective board dimension E. Mounting holes improperly positioned F. Circuitry problems on final test G. Wrong component 71 223 169 18 120 415 500 400 Number of defects 200 Print Done GCDA F B E b) The Pareto chart indicates that most of the errors, %, are the result of (round your response to one decimal place). 1 More Info Based on the data, choose the correct graph below. A. 600- 400- Number of defects 200- circuitry problems on final test 0- C G D F A B E components not adhering led 600 wrong component excess adhesive 400- Number of defects misplaced transistors 200- mounting holes improperly positioned ne 0- CD AF BE defective board dimension b) The Pareto chart indicates that most of the errors, 1%, are the result of fropind you Enter your answer in the answer box and then click Check Answer. Clear All All parts showing
Step by Step Solution
There are 3 Steps involved in it
1 Expert Approved Answer
Step: 1 Unlock

Question Has Been Solved by an Expert!
Get step-by-step solutions from verified subject matter experts
Step: 2 Unlock
Step: 3 Unlock