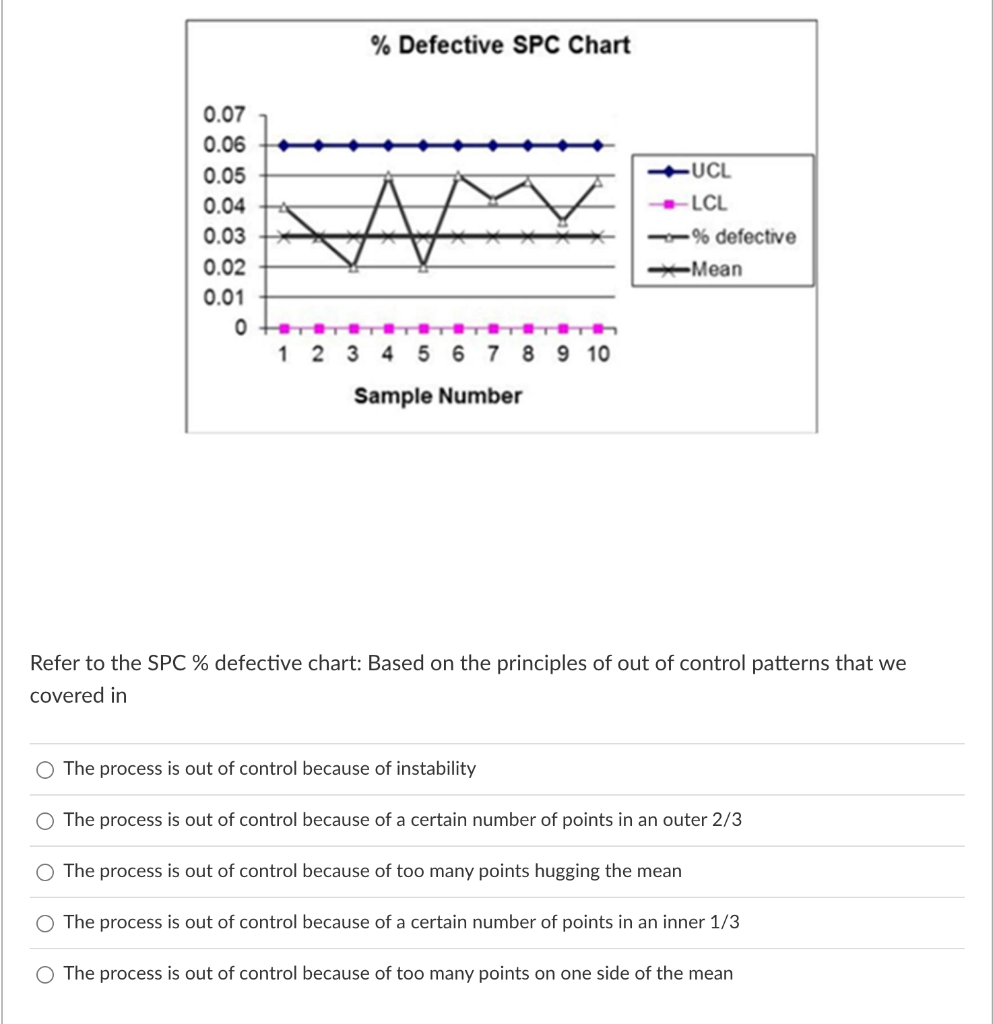
Question: % Defective SPC Chart 0.07 0.06 0.05 0.04 0.03 0.02 0.01 0+ 1 2 3 4 5 6 7 8 9 10 Sample Number A

% Defective SPC Chart 0.07 0.06 0.05 0.04 0.03

% Defective SPC Chart 0.07 0.06 0.05 0.04 0.03 0.02 0.01 0+ 1 2 3 4 5 6 7 8 9 10 Sample Number A UCL LCL -% defective Mean Refer to the SPC % defective chart: Based on the principles of out of control patterns that we covered in O The process is out of control because of instability The process is out of control because of a certain number of points in an outer 2/3 The process is out of control because of too many points hugging the mean The process is out of control because of a certain number of points in an inner 1/3 O The process is out of control because of too many points on one side of the mean

Step by Step Solution

There are 3 Steps involved in it

1 Expert Approved Answer
Step: 1 Unlock blur-text-image
Question Has Been Solved by an Expert!

Get step-by-step solutions from verified subject matter experts

Step: 2 Unlock
Step: 3 Unlock

Students Have Also Explored These Related General Management Questions!