

Question: define operational risk and explain three operational risk factors identified from the bp deepwater and provide mitigating control measures define risk appetite with an aod
define operational risk and explain three operational risk factors identified from the bp deepwater and provide mitigating control measures
define risk appetite with an aod of diagram discuss different approaches to operational risk appetite at the four management level in a firm
I needed all question...but its late so only question 1 will do...please its rather urgent
please cancel the request...you have not been much help... how do I claim refund...this is dissapponting.
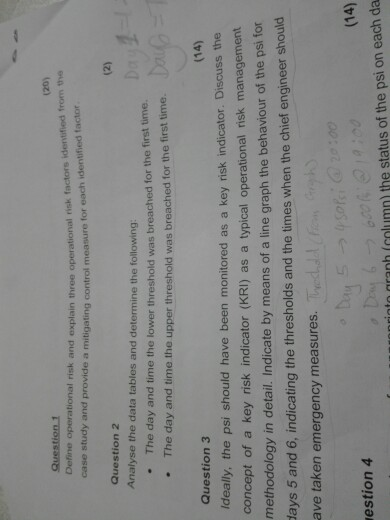
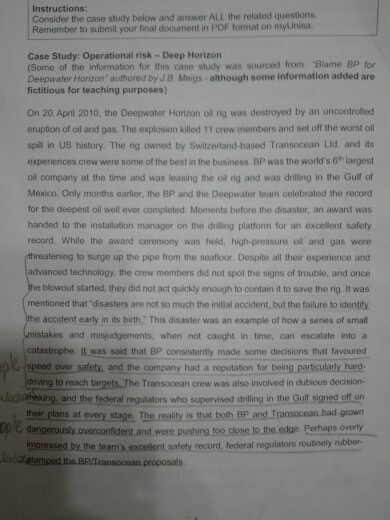
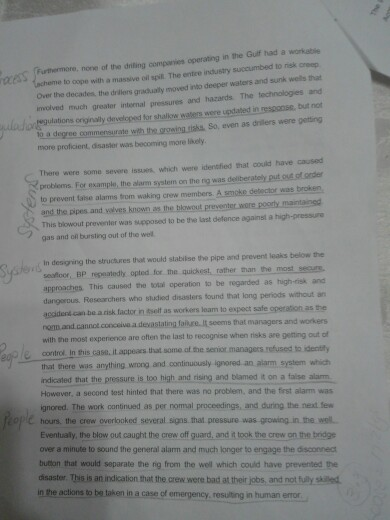
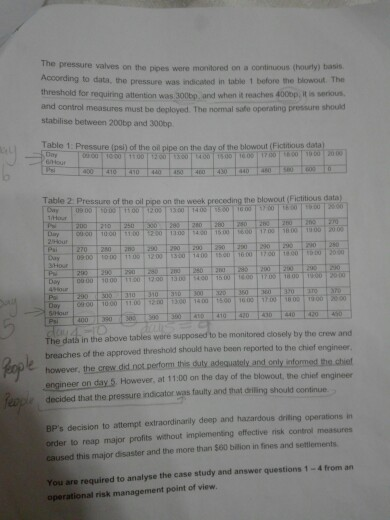
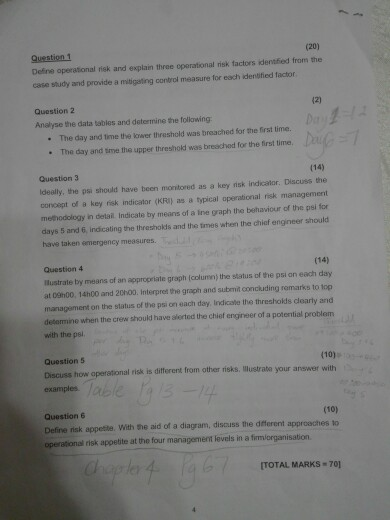
Define operational risk and explain three operational risk factors Identified from the (20) case study and provide a mitigating control measure for each identified factor (2) Question 2 Analyse the data tables and determine the following: The day and time the lower threshold was breached for the first time. The day and time the upper threshold was breached for the first time Daup = Question 3 (14) Ideally, the psi should have been monitored as a key risk indicator. Discuss the concept of a key risk indicator (KRI) as a typical operational risk management methodology in detail. Indicate by means of a line graph the behaviour of the psi for days 5 and 6, indicating the thresholds and the times when the chief engineer should ave taken emergency measures. Techde i Gry Day 45015 20:00 Day 6 -> bool @ 19:00 vestion 4 (14) to aranh (column the status of the psi on each da Instructions: Consider the case study below and answer ALL the related questions Remember to submit your final document in PDF format on myunisa Case Study: Operational risk - Deep Horizon (Some of the information for this case study was sourced from 'Blame BP for Deepwater Horizon authored by J.B. Meigs although some information added are fictitious for teaching purposes) On 20 April 2010, the Deepwater Horizon oil rig was destroyed by an uncontrolled eruption of oil and gas. The explosion killed 11 crew members and set off the worst oil spill in US history. The ng owned by Switzerland-based Transocean Lid and its experiences crew were some of the best in the business. BP was the world's largest oil company at the time and was leasing the oil rig and was drilling in the Gulf of Mexico. Only months earlier, the BP and the Deepwater team celebrated the record for the deepest oil well ever completed. Moments before the disaster, an award was handed to the installation manager on the drilling platform for an excellent safely record. While the award ceremony was held, high-pressure oil and gas were threatening to surge up the pipe from the seafloor. Despite all their experience and advanced technology, the crew members did not spot the signs of trouble, and once the blowout started, they did not act quickly enough to contain it to save the rig. It was mentioned that disasters are not so much the initial accident, but the failure to identify the accident early in its birth. This disaster was an example of how a series of small mistakes and misjudgements, when not caught in time, can escalate into a catastrophe. It was said that BP consistently made some decisions that favoured speed aver safety, and the company had a reputation for being particularly hard- driving to reach targets. The Transocean crew was also involved in dubious decision documeking, and the federal regulators who supervised drilling in the Gulf signed off on their plans at every stage. The reality is that both BP and Transocean had grown dangerously overconfident and were pushing too close to the edge. Perhaps overly impressed by the team's excellent safety record, federal regulators routinely rubber ratamped the BPTransocean proposals ople ocess from now of the dileng companies operating in the Gut had a work scheme to cope with a massive oil spil. The ente industry succumbed to make Over the decades the drivers gradually moved to deeper waters and sun wes that wolved much greater internal pressures and hazards. The technologies and regulations orginally developed for shallow waters were updated in conse, but not 10 a degree commensurate with the growing isht. So, even as driers were getting more proficient, disaster was becoming more likely There were some severe ses which were identified that could have caused problems. For example, the alarm system on the ng was deliberately put out order to prevent fase alarms from waking crew members. A smoke detector was broken and the pipes and waves known as the blowout preventer wore poorly maintained This blowout prevent was sucposed to be the last defonce against high-pressure gas and oil bursting out of the well in designing the structures that would stabilise the pipe and prevent leaks below the safloor, BP repeatedly opted for the quickest, rather than the most secure approaches. This caused the total operation to be regarded as high-risk and dangerous. Researchers who studied disasters found that long periods without an accident can be a risk factor in tot as workers beam to expect safe operation as the nomand cannot conceive a devastating failure. It seems that managers and workers with the most experience are often the last to recognise when risks are getting out of control in this case, it anpears that some of the senior managers refused to identity that there was anything wrong and continuously ignored an alarm system which indicated that the pressure is too high and rising and blamed it on a false alarm However, a second tot hinted that there was no problem, and the first alarm was ignored. The work continued as per normal proceedings, and during the next few hours, the crew overlooked several signs that pressure was growing in the well Eventually, the blow out caught the crew off guard, and it took the crew on the bridge over a minute to sound the general alarm and much longer to engage the disconnect button that would separate the ng from the well which could have prevented the saster. This is an indication that the crew were bad at their jobs, and not fully se in the actions to be taken in a case of emergency, resulting in human error People The pressure valves on the pipes were monitored on a continuous hourly basis. According to data, the pressure was indicated in tablet before the blowout. The threshold for requiring attention was 30060, and when it reaches 4000p, it is serious and control measures must be deployed. The normal safe operating pressure should stabilise between 200bp and 300bp. Table 1: Pressure (ps) of the oil pipe on the day of the blowout (Fictitious data 0001000100000000000017000000000 410 Table 2. Pressure of the oil pipe on the week preceding the blowout (Fictitious data) Dwy 090000 1200 13000 1600 15.00 210 10 0000 10000 10000 1000 10000 P 20 Day HO 000000000000000000000 Day Po Doy 30 20 30 000000001300 100 100 1000 11000000 430 Psi 390 people People The data in the above tables were supposed to be monitored closely by the crew and breaches of the approved threshold should have been reported to the chief engineer however, the crew did not perform this duty adequately and only informed the chief engineer on day 5. However, at 11:00 on the day of the blowout, the chief engineer decided that the pressure indicator was faulty and that drilling should continue BP's decision to attempt extraordinarily deep and hazardous driting operations in order to reap major profits without implementing effective risk control measures caused this major disaster and the more than 500 bilion in fines and settlements You are required to analyse the case study and answer questions 1 - 4 from an operational risk management point of view. Question 1 (20) Define operational risk and explain three operational risk factors identified from the case study and provide a mitigating control measure for each identified factor (2) Question 2 Analyse the data tables and determine the following: The day and time the lower threshold was breached for the first time. The day and time the upper threshold was breached for the first time, Bigg =) Question 3 (14) Ideally, the pi should have been monitored as a key risk indicator Discuss the concept of a key risk indicator (KRI) as a typical operational risk management methodology in detail indicate by means of a ine graph the behaviour of the pal for days 5 and 6 Indicating the thresholds and the times when the chief engineer should have taken emergency measures Question 4 Hlustrate by means of an appropriate graph columns the status of the psi on each day at 14h00 and 20h00. Interpret the graph and submit concluding remarks to top management on the status of the psi on each day, Indicate the thresholds clearly and determine when the crew should have alerted the chief engineer of a potential problem with the pol D Question 5 (10) Discuss how operational risk is different from other risks, llustrate your answer with examples Table Pg 13-14 Question 6 (10) Define risk appetite. With the aid of a diagram, discuss the different approaches to operational risk appetite at the four management levels in a fimorganisation Chapter of Pg 67 TOTAL MARKS-70]Step by Step Solution
There are 3 Steps involved in it
1 Expert Approved Answer
Step: 1 Unlock

Question Has Been Solved by an Expert!
Get step-by-step solutions from verified subject matter experts
Step: 2 Unlock
Step: 3 Unlock