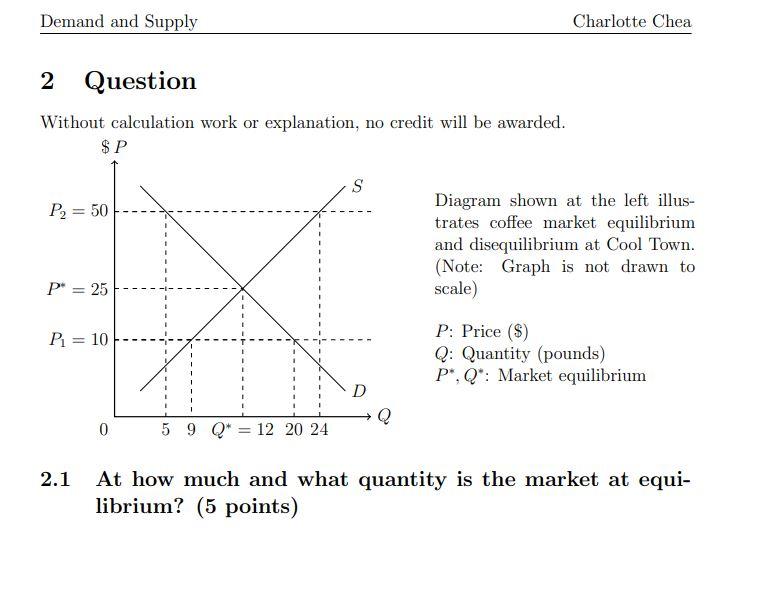
Question: Demand and Supply Charlotte Chea 2 Question Without calculation work or explanation, no credit will be awarded. $P S P = 50 Diagram shown at

Demand and Supply Charlotte Chea 2 Question

Demand and Supply Charlotte Chea 2 Question Without calculation work or explanation, no credit will be awarded. $P S P = 50 Diagram shown at the left illus- trates coffee market equilibrium and disequilibrium at Cool Town. (Note: Graph is not drawn to scale) P = 25 P = 10 P: Price ($) Q: Quantity (pounds) P". Q: Market equilibrium D 0 5 9 Q* = 12 20 24 At how much and what quantity is the market at equi- librium? (5 points)

Step by Step Solution

There are 3 Steps involved in it

1 Expert Approved Answer
Step: 1 Unlock blur-text-image
Question Has Been Solved by an Expert!

Get step-by-step solutions from verified subject matter experts

Step: 2 Unlock
Step: 3 Unlock

Students Have Also Explored These Related General Management Questions!