

Question: please help with this question 1 Question Without calculation work or explanation, no credit will be awarded. SP P2 = 50 Diagram shown at the
please help with this question
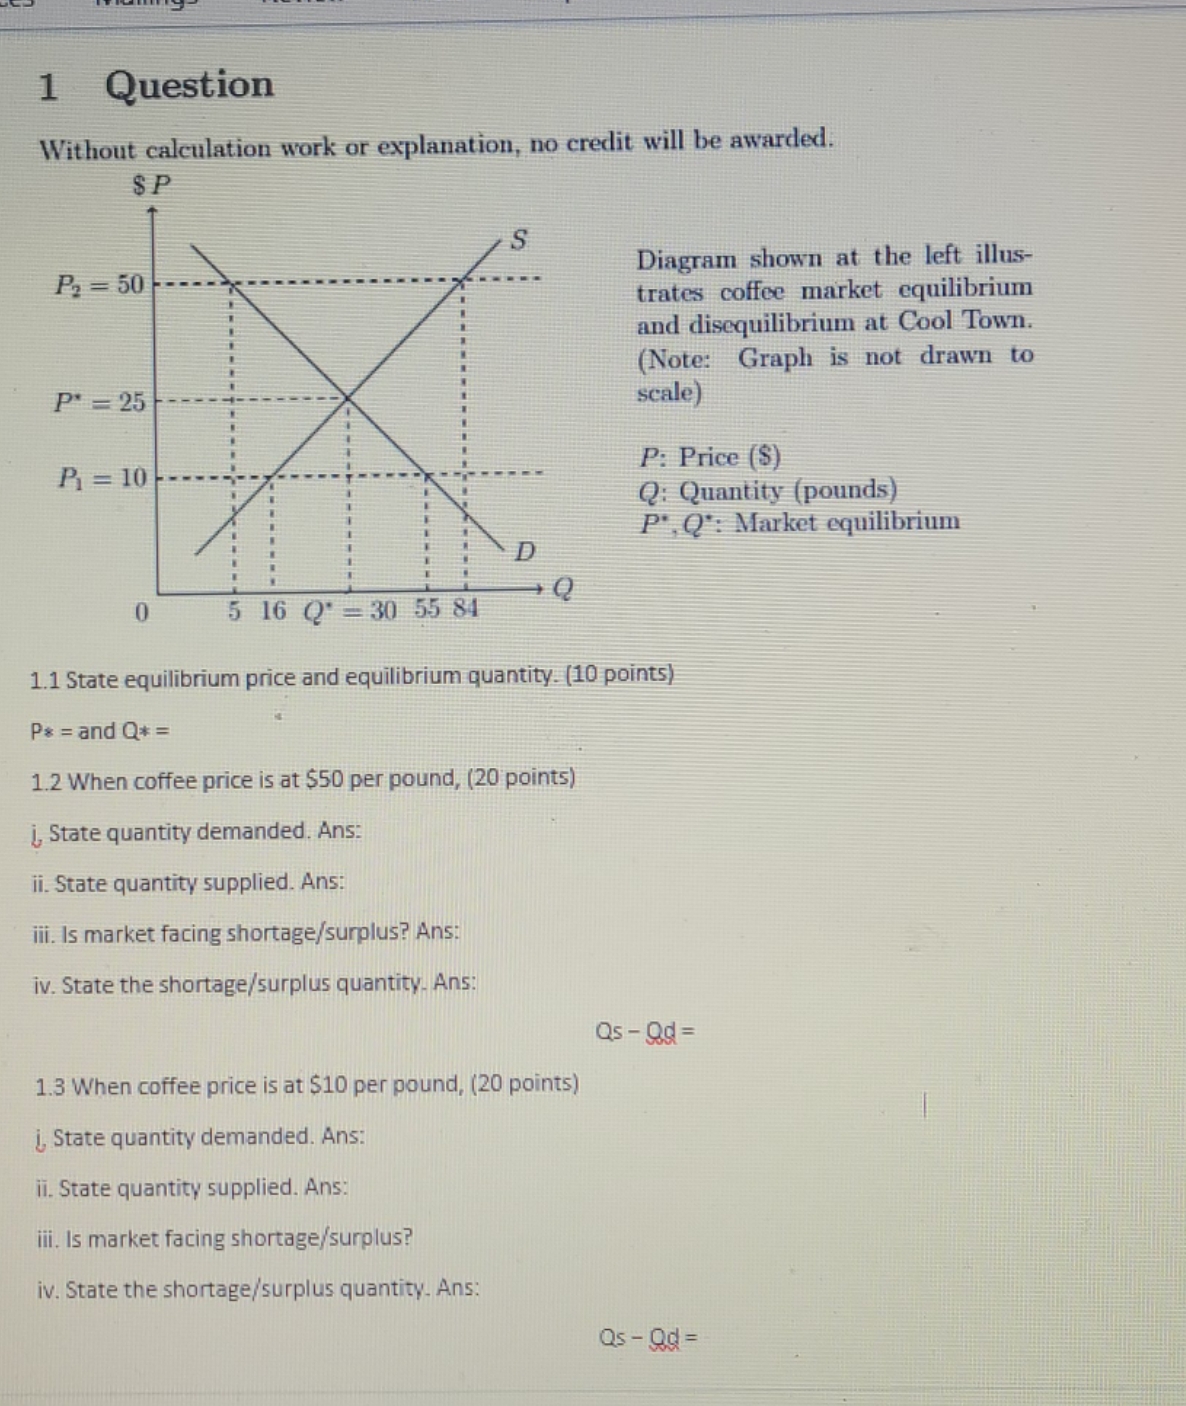
1 Question Without calculation work or explanation, no credit will be awarded. SP P2 = 50 Diagram shown at the left illus- trates coffee market equilibrium and disequilibrium at Cool Town. (Note: Graph is not drawn to P' = 25 scale) P1 = 10 P: Price ($) Q: Quantity (pounds) P', Q': Market equilibrium 5 16 Q' = 30 55 84 Q 1.1 State equilibrium price and equilibrium quantity. (10 points) P& = and Q* = 1.2 When coffee price is at $50 per pound, (20 points) i State quantity demanded. Ans: ii. State quantity supplied. Ans: iii. Is market facing shortage/surplus? Ans: iv. State the shortage/surplus quantity. Ans: Qs - Qd = 1.3 When coffee price is at $10 per pound, (20 points) i State quantity demanded. Ans: ii. State quantity supplied. Ans: iii. Is market facing shortage/surplus? iv. State the shortage/surplus quantity. Ans: Qs - Qd =
Step by Step Solution
There are 3 Steps involved in it

Get step-by-step solutions from verified subject matter experts