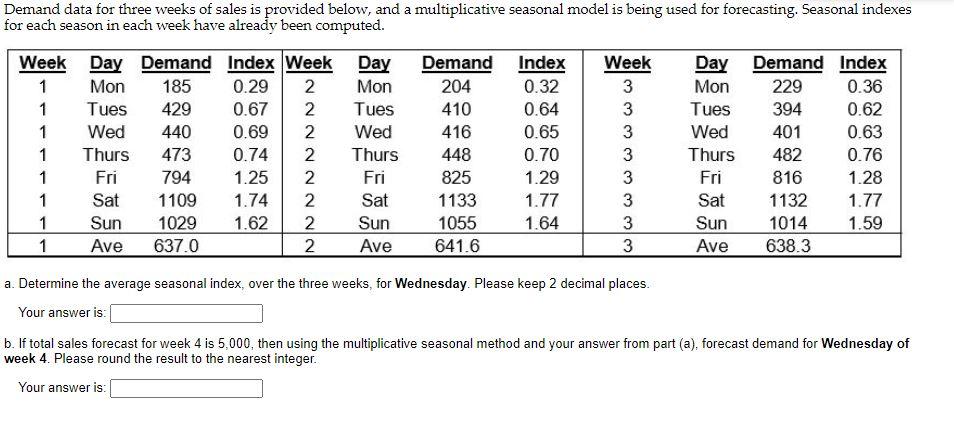
Question: Demand data for three weeks of sales is provided below, and a multiplicative seasonal model is being used for forecasting. Seasonal indexes for each season

Demand data for three weeks of sales is provided

Demand data for three weeks of sales is provided below, and a multiplicative seasonal model is being used for forecasting. Seasonal indexes for each season in each week have already been computed. Week Day Demand Index Week Day 1 Mon 185 0.29 2 Mon 1 Tues 429 0.67 2 Tues 1 Wed 440 0.69 2 Wed 1 Thurs 473 0.74 2 Thurs 1 Fri 794 1.25 2 1 Sat 1109 1.74 2 Sat 1 Sun 1029 1.62 2 Sun 1 Ave 637.0 2 Ave Demand 204 410 416 448 825 1133 1055 641.6 Index 0.32 0.64 0.65 0.70 1.29 1.77 1.64 Week 3 3 3 3 3 3 3 3 Day Demand Index Mon 229 0.36 Tues 394 0.62 Wed 401 0.63 Thurs 482 0.76 Fri 816 1.28 Sat 1132 1.77 Sun 1014 1.59 Ave 638.3 Fri a. Determine the average seasonal index, over the three weeks, for Wednesday. Please keep 2 decimal places. Your answer is: b. If total sales forecast for week 4 is 5,000, then using the multiplicative seasonal method and your answer from part (a), forecast demand for Wednesday of week 4. Please round the result to the nearest integer. Your answer is

Step by Step Solution

There are 3 Steps involved in it

1 Expert Approved Answer
Step: 1 Unlock blur-text-image
Question Has Been Solved by an Expert!

Get step-by-step solutions from verified subject matter experts

Step: 2 Unlock
Step: 3 Unlock

Students Have Also Explored These Related General Management Questions!